The cost of living crisis was the period from 2021 onwards when prices across the UK rose far faster than incomes, driven above all by energy. When a parliamentary committee first took evidence on it in February 2022, inflation was forecast to peak at 7.25% in April 20221. The reality was worse: inflation reached 11.1% at its peak, the highest rate of the last four decades2.
The causes were a combination of strong global demand for consumer goods as economies recovered from the Covid-19 pandemic, supply chain disruption, and soaring energy and fuel prices, sharpened by Russia's invasion of Ukraine in 20223. Between March 2021 and March 2024, the cost of electricity, gas and other fuels rose by 90%4. Government responded with direct payments to households: people on low income benefits or tax credits received Cost of Living Payments of £326, £324, £301, £300 and £299 across 2022 to 20245, and more than 8 million households on means-tested benefits received up to £900 in 2023/246.
What the cost of living crisis was and when it started
The crisis is usually dated from late 2021, when energy prices began climbing, and it ran through 2022 and 2023 as the rises spread from gas and electricity into food, goods and services. Inflation itself is a general rise in prices across the economy; what made this period a crisis was its speed and its concentration in essentials, the things no household can avoid buying. A 90% rise in the cost of electricity, gas and other fuels between March 2021 and March 20244 hit every household that heats a home, and it hit hardest those who spend the largest share of their income on energy.
The parliamentary committee that tracked the crisis noted that forecasts made in early 2022 proved too optimistic: the 7.25% peak expected for April 20221 was overtaken by events, above all the invasion of Ukraine and its effect on gas markets. The Bank of England has since described the sharp rise in the cost of energy and some food products caused by that invasion as one of the main causes of the inflation that followed9.
Government support came in several waves. Households on low income benefits or tax credits received Cost of Living Payments of £326, £324, £301, £300 and £299 on certain dates between 2022 and 20245. The first payment of the 2023/24 round, £301, was made between 25 April and 17 May 20236. The estimated total cost of the Cost of Living Payments was around £20bn4. Alongside these, energy bills themselves were held down by the Energy Price Guarantee, covered in the next section.
Energy bills: the peak under the Energy Price Guarantee and the fall since
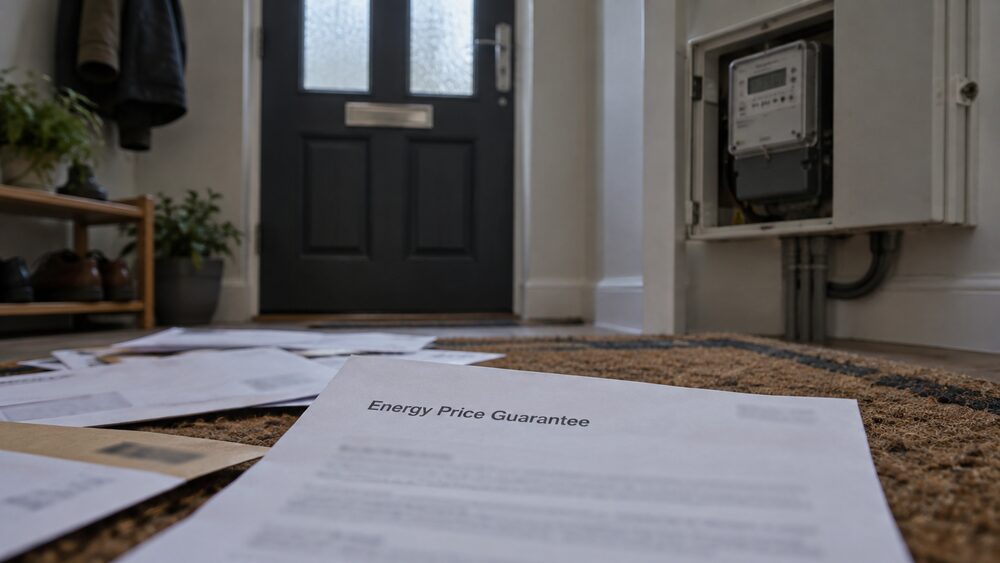
Energy bills were the centre of the crisis. Without intervention, the October 2022 price cap would have meant a far larger jump in bills; instead, the Energy Price Guarantee limited the increase to 27% in October 20227. Under the guarantee, the typical household bill peaked at £2,106 a year, and that level applied from October 2022 to June 20237. The UK Government funded the difference between the maximum price consumers paid and the Energy Price Cap3, which is why the guarantee cost the public purse so much.
After the guarantee ended, bills fell in steps but never back to their pre-crisis level. The cap stood at £1,849 in the second quarter of 2025 and £1,755 in the final quarter of 202510. It rose slightly, by 0.2%, in January 2026 to £1,758 a year for a typical household using electricity and gas and paying by direct debit8. Two figures are quoted for the middle of 2026: around £1,663 a year for a medium use household paying by direct debit until the end of September 2026, and around £1,723 from 1 October 2026; the documents that carry them disagree, so both are given here. The longer view is stark: bills for typical consumption under the October to December 2026 price cap will be 58% higher than in winter 2021/22, and still 18% higher than the recent low of July to September 20247.
How the energy price cap works and what it does not cover
The price cap is often described as a cap on bills, but it is not. Ofgem's energy price cap sets the maximum unit price per kWh and the maximum daily standing charge that suppliers can charge12. If a household uses more energy, it pays more; the widely quoted annual figures are what a household with typical consumption would pay over a year, not a maximum. A separate price cap is set for each of the 14 energy supply regions, and each cap applies throughout its region7.
The cap's detail matters to household budgets in ways the headline misses. Average standing charges increased by 13% for electricity and 6% for gas in the April to June 2024 cap7, and standing charges are paid regardless of how much energy is used. Unit prices have moved differently: the average price of electricity increased by 1% to 26.3 p/kWh in the October 2026 cap7, a figure that includes the removal of VAT from electricity bills for six months.
The cap applies to default and variable tariffs, the tariffs households move to when a fixed deal ends. Fixed tariffs are priced by suppliers and can sit above or below the cap. The dedicated guide to the energy price cap explains how Ofgem sets it each quarter, and the Energy Price Guarantee page covers the 2022 to 2023 support scheme in full.
Interest rates: why Bank Rate rose and how it has come down
The Bank of England's response to inflation was to raise Bank Rate, the single most important interest rate in the UK. The Monetary Policy Committee (MPC) usually votes on Bank Rate eight times a year13, with the aim of keeping inflation as close as possible to a target of 2%13. It can also act between scheduled meetings: it did so in March 2020, cutting the rate because of the potential effects of the coronavirus on the economy13.
Worked examples published by the Financial Ombudsman Service show how far the rate moved and how it has since eased: 4.75% in the period from 15 January 2025 to 5 February 2025, and 4.50% from 6 February 2025 to 7 May 202514. In 2024 the base rate was cut four times, each by 0.25 percentage points, in February, May, August and December13, and it has been at that level since December 202513.
The mechanism is spending. In the Bank of England's own words:
"In short, higher interest rates will work because they will mean that less money will be spent in the UK (than if interest rates had not changed)"9
Higher rates make borrowing more expensive and saving more rewarding, so households and firms spend less, and the pressure on prices eases. The trade-off is that the households doing the borrowing, particularly those with mortgages, carry much of the burden of bringing inflation down. The Monetary Policy Committee page explains who sits on the committee and when it meets, and Bank Rate history covers past changes in full.
What higher rates meant for mortgages and savings
Rate changes mainly affect people with variable mortgages15: their payments move as Bank Rate moves, or soon after. Borrowers on fixed rates were protected while their fix lasted, but every fix that ended during the crisis rolled onto far more expensive terms, and new borrowing became costlier across the market. In April 2025, an average 2-year 75% loan-to-value mortgage offered a rate of 4.43%, down from 4.53% in March16, a sign that mortgage costs were easing but remained well above their pre-crisis levels.
Higher rates also fed into the housing market. Average UK house prices increased by 1.3%, to £268,000, in the 12 months to January 2026 (provisional estimate)17, a much slower pace than the years before. For context, average house prices in the UK have risen by more than 30% since the Lifetime ISA was introduced in April 201718. Government schemes had their own effects: an evaluation found that the increase in the maximum loan value in London under Help to Buy led to an estimated 8% increase in new build prices in London19.
For savers, the same forces worked in reverse: the rates on offer rose as Bank Rate rose, though not every account followed. Meanwhile, benefits and the State Pension were uprated by 10.1% for the financial year ending 2024, reflecting the inflation figure the previous September20, one of the ways the system partially protected incomes from the price shock. The guides to how a Bank Rate change affects your mortgage, average mortgage interest and average savings interest cover each side in detail.
Measuring price rises: CPI, CPIH and the Household Costs Index
Inflation is measured, not observed. The Office for National Statistics (ONS) publishes consumer price inflation monthly for the whole UK, based on a representative sample of approximately 760 goods and services, reviewed annually, with around 180,000 price quotations collected each month from approximately 20,000 outlets21. Local price collectors visit 20,000 shops in around 150 locations to collect over 100,000 prices, with around 160 items collected centrally21.
The headline measures differ in what they cover. The Consumer Prices Index including owner occupiers' housing costs (CPIH) is the most comprehensive measure, because it includes owner occupiers' housing costs and Council Tax, which are excluded from the CPI21. In the 12 months to June 2026, CPIH rose by 2.8%22. In the 12 months to August 2026, CPI rose by 3.1%, up from 2.9% the previous month, and CPIH rose by 3.3%23. The CPI is the only UK inflation index currently designated as an Accredited Official Statistic24.
The Household Costs Index (HCI) approaches the question from the household's side. It includes changes in mortgage interest rates, stamp duty and other costs related to the purchase of a dwelling, which the CPI omits25, and it uses democratic weights, based on the average household's share of expenditure26. Overall UK household costs, as measured by the HCI, rose by 2.8% in the year to June 202625. The HCIs are official statistics in development26, a status that means the figures are still being evaluated. The pages on CPI and CPIH, the Household Costs Index and the inflation basket explain each measure.
Why inflation hit some households harder than others
The official inflation rate is an average, and no household is average. In the year to October 2022, at the worst of the energy shock, low-income households faced a higher HCI inflation rate than high-income households by a margin of 2.0 percentage points27. By the year to March 2024 that gap had narrowed to 1.1 percentage points, down from 1.4 percentage points in October and November 202327. Lower electricity, gas and other fuel prices reduced the rate more for low-income households, adding a further 0.60 percentage points to the narrowing of the gap27.
Over the longer term the differences even out: cumulative inflation over the past five years to June 2026 was 32.8% for high-income households and 32.7% for low-income households25. But the timing mattered enormously. A household that spent a large share of its budget on energy and food in 2022 and 2023 experienced the peak of the crisis at its most intense, with no room to substitute away from essentials.
Housing costs deepened the divide. In the financial year ending 2024, an average-priced home in England was 13 times a lower-income household's income (the lowest-income 20%), compared with a far lower multiple for higher earners28. Households spent £113.30 a week, 18% of total expenditure, on housing (net), fuel and power in the financial year ending 2024, up £4.30 (4%) on the previous year29. Households nominally increased their weekly spending on energy and fuel by £14.80 (58%) since the financial year ending 202229. The comparison of CPIH and the Household Costs Index shows why the choice of measure changes the picture.
Where energy bills and interest rates stand now
The acute phase of the crisis has passed, but the price level has not returned to where it was. Energy prices are still around one and a half times what they were before the gas crisis arising from the Ukraine conflict30. Bills for typical consumption under the October to December 2026 price cap will be 58% higher than in winter 2021/227, and the typical bill from January 2026 was £1,758 a year8.
Public concern has eased only slowly. In a survey in November 2024, 85% of UK adults felt the cost of living was one of the most important issues facing the UK, level with the NHS at 86%31. Support during the crisis was distributed across the nations: UK government energy and cost of living support measures were worth £2.1 billion in Northern Ireland and £3.7 billion in Wales across 2022 to 2023 and 2023 to 202432.
Interest rates have come down from their peak but remain above their pre-crisis levels, with the base rate unchanged since December 202513. Inflation, at 3.1% in the 12 months to August 202623, sits above the 2% target13. The latest UK inflation figures page tracks each release, and the section guide to Bank Rate, inflation and the UK economy pulls the threads together.
Falling behind on bills or housing payments: where to get help
If you are struggling to pay energy bills, rent or housing costs now, support exists and does not depend on the crisis still being in the headlines. Local welfare funds provide two main kinds of help in England: a Housing Payment, providing financial support towards housing needs to those who face a shortfall in meeting their housing costs, and a Crisis Payment, providing support to those in crisis, for example with essential costs such as food, energy bills, water bills and other essentials33. Scotland and Wales run their own schemes, and the rules differ between the nations.
A practical order of steps:
- Check what benefits and support you are entitled to, including any local welfare provision, before assuming nothing is available33.
- Contact your energy supplier if you cannot pay: suppliers have arrangements for customers in difficulty, and pre-payment meter customers have their own protections.
- Take stock of all your debts together rather than one at a time, so that priority costs, housing, energy and food, are protected first.
- Get free, independent debt advice before borrowing more or missing payments; the guide to debt sets out the options and your rights.
Sources33 cited
- Work and Pensions Committee report on the cost of living crisis, summary UK Parliament, 2022
- Child poverty in the UK and Scotland Scottish Government, 2026
- Understanding the cost of living crisis in Scotland, page 2 Scottish Government, 2025
- Understanding the cost of living crisis in Scotland, full report Scottish Government, 2025
- Cost of Living Payments mygov.scot, 2023
- Work and Pensions Committee report on Cost of Living Payments 2023/24 UK Parliament, 2024
- Energy price cap research briefing CBP-9714 House of Commons Library, 2026
- Scottish Economic Bulletin, December 2025, page 9 Scottish Government, 2025
- How do higher interest rates help to lower inflation? Bank of England, 2023
- Scottish Economic Insights, September 2025, page 6 Scottish Government, 2025
- What is the energy price cap? Which?, 2026-08-27
- Fuel poverty scenario modelling based on Ofgem energy price caps Scottish Government, 2026
- Bank of England base rate and your mortgage Which?, 2026
- Financial Ombudsman Service guidance on new interest awards Financial Ombudsman Service, 2026
- What do I need to know about debt? Bank of England, 2025
- Scottish Economic Bulletin 2025, page 7 Scottish Government, 2025
- Private rent and house prices in the UK, March 2026 edition ONS, 2026
- Treasury Committee report 607 UK Parliament, 2025
- Evaluation of the Help to Buy scheme, evaluation findings report UK Government, 2026
- The effects of taxes and benefits on household income, 2024 ONS, 2024
- Consumer price inflation QMI: CPIH, CPI and RPI ONS, 2026
- Consumer price inflation, June 2026 ONS, 2026
- Consumer price inflation, August 2026 ONS, 2026
- Poverty and Income Inequality Report, quality and methodology NISRA, 2026
- Household Costs Indices for UK household groups, April to June 2026 ONS, 2026
- Household Costs Indices for UK household groups, January to March 2026 ONS, 2026
- Household Costs Indices for UK household groups, January to March 2024 ONS, 2024
- Housing purchase affordability, Great Britain, 2024 ONS, 2024
- Family spending in the UK, April 2023 to March 2024 ONS, 2024
- Work and Pensions Committee report 465 UK Parliament, 2025
- Understanding the cost of living crisis in Scotland, page 6 Scottish Government, 2025
- Impact of UK government energy and cost of living support measures on households across the UK UK Government, 2022
- Local welfare fund guidance entitledto, 2026




 MoneyHelperFree, impartial money and pensions guidance, set up by government
 Citizens AdviceFree advice on money, consumer and legal problems in England and Wales
 GOV.UKOfficial information on tax, benefits and government services
 StepChangeFree debt advice and solutions from a charity
 FSCSProtects your money if a bank, insurer or investment firm fails