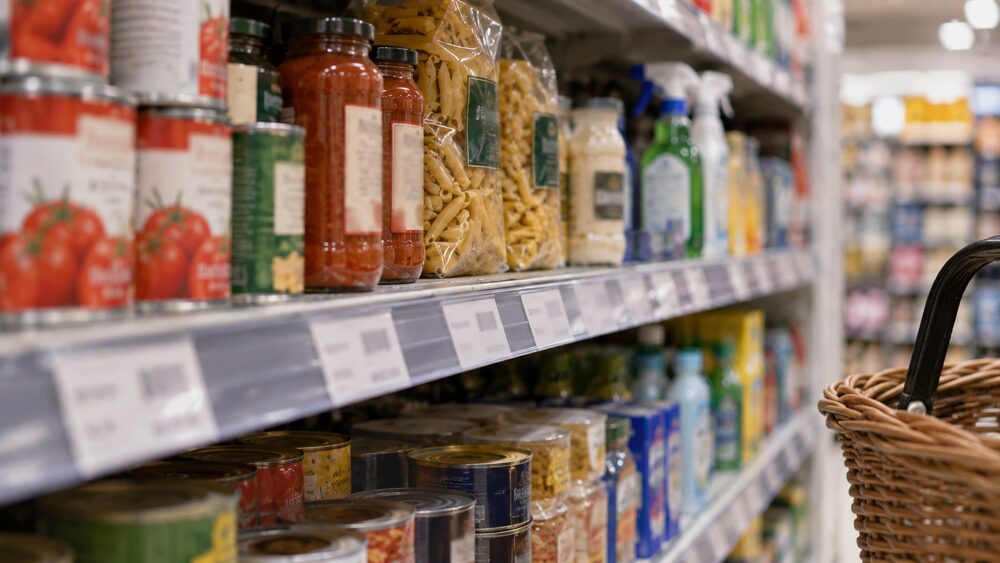
CPI and CPIH are the two headline measures of consumer price inflation in the UK, both produced each month by the Office for National Statistics (ONS). The Consumer Prices Index (CPI) measures the average change in the prices of a basket of goods and services that people buy. The Consumer Prices Index including owner occupiers' housing costs (CPIH) is the same measure with one big addition: the housing costs of people who own their home, plus council tax, both of which CPI leaves out1.
In the 12 months to August 2026, CPIH rose by 3.3% and CPI rose by 3.1%2. CPIH is the ONS's lead measure of inflation, based on economic principles, because it is the most comprehensive picture of what households pay3. But CPI is the measure the government uses in practice: it is the index the Government asks the Bank of England to target, and it is used for uprating state pensions and benefits1.
Both figures are published monthly, about four or five weeks after prices are collected, and publication has never been delayed or missed1. The release covering August 2026 was published on 16 September 2026, and the next is due on 21 October 20265.
CPIH includes housing costs that CPI leaves out
The single most important difference between the two measures is housing. The ONS describes CPIH as "the most comprehensive measure of inflation as it includes owner occupiers' housing costs and Council Tax, which are excluded from the CPI"1. CPI was first published in 1997 as the Harmonised Index of Consumer Prices, a measure designed to be comparable across European countries, and that international framework is why owner occupiers' housing costs were left out1. CPIH was introduced to address this gap in 2017, when it became the ONS's lead inflation index1.
For most people who own their home, the cost of living in it is one of the largest regular outgoings, so a measure that omits it can understate what they experience. Council tax is the same: it is a significant bill for almost every household, and it is not in CPI at all. In the Household Costs Indices, a separate set of ONS measures, council tax contributed 0.21 percentage points to the annual rate for all households in June 20267.
The gap between the measures is usually modest because housing costs are only one part of the basket, but it widens when housing costs move differently from other prices. In the 12 months to August 2026, CPIH at 3.3% sat 0.2 percentage points above CPI at 3.1%2.
The Household Costs Indices go further still: they include changes in mortgage interest rates, stamp duty and other costs related to the purchase of a dwelling, which are omitted from CPI7. The Household Costs Index is covered in its own guide, and the comparison between the two is set out in CPIH or the Household Costs Index.
Owner occupiers' housing costs: 16.5% or about 18% of CPIH
Owner occupiers' housing costs (OOH) are the largest single thing CPIH adds. The ONS methodology states that OOH currently accounts for 16.5% of the expenditure weight of CPIH1. More recent ONS bulletins describe the OOH component as accounting for approximately 18% of CPIH2. The two figures come from different documents and different points in the weighting cycle, so both are given here; the weight is updated each year.
CPIH measures these costs using an approach called rental equivalence1. Rather than tracking mortgage payments, the ONS estimates the rent an owner occupier would pay to live in their home as if they were renting it. The idea is that this captures the cost of the housing service itself, the benefit of living in the home, separately from the cost of buying an asset that can be sold later.
The size of the weight means housing moves the headline. In August 2026, the largest contributing division to CPIH was housing and household services, with a 1.32 percentage point contribution to the CPIH rate2. The OOH division itself rose by 3.9% over the 12 months to August 20262. When housing costs rise faster than other prices, CPIH rises further above CPI than usual, and when they fall, the gap narrows.
The latest CPIH figure: 3.3% over 12 months
CPIH rose by 3.3% in the 12 months to August 2026, up from 3.1% in the 12 months to July 20262. CPI rose by 3.1% in the 12 months to August 2026, up from 2.9% the previous month2. On a monthly basis, CPIH rose by 0.5% in August 2026, compared with a rise of 0.3% in August 20252.
Within the headline, the picture was mixed. The CPIH goods annual rate rose from 2.2% to 2.7%, while the CPIH services annual rate was unchanged at 3.6%2. Core CPIH, which excludes energy, food, alcohol and tobacco, rose by 2.9% in the 12 months to August 20262. Food and non-alcoholic beverages rose by 1.3%2. Housing and household services rose by 4.3%, up from 4.1% in July2.
| Measure | 12-month rate, August 2026 | Previous month |
|---|---|---|
| CPIH | 3.3%2 | 3.1%9 |
| CPI | 3.1%2 | 2.9%2 |
| CPIH goods | 2.7%2 | 2.2%2 |
| CPIH services | 3.6%2 | 3.6%2 |
| Core CPIH | 2.9%2 | 2.8%2 |
For context, these figures are far below the peak of the cost of living crisis. Measured by CPIH, inflation reached 9.6% in October 2022, and the ONS's constructed historical estimates indicate the last time inflation was higher was in December 198010. The CPIH series itself only began in January 200610. The cost of living crisis and latest inflation figures are covered in their own guides.
Monthly and 12-month rates measure different things
Two numbers appear in every release, and they answer different questions. The monthly rate is the change in prices between one month and the next: CPIH rose by 0.5% between July and August 20262. The 12-month rate compares the price level with the same month a year earlier: 3.3% for CPIH in August 20262. The 12-month rate is what is normally meant by "the inflation rate" in news coverage and in the setting of benefits and pensions.
The two can move in opposite directions. If prices rose sharply in the same month a year ago, a modest rise this month can still pull the 12-month rate down, because the comparison base is high. Equally, a small monthly rise can leave the annual rate unchanged if last year's rise was similar. This is why a single month's figure rarely tells you much on its own, and why the ONS publishes both alongside each other2.
The index level behind the rates is also published. The official CPIH series, based on 2015 equals 100, started in 20131.
How prices are collected: around 180,000 each month
The figures rest on a large collection operation. The ONS collects approximately 180,000 price quotations each month1. Local price collectors visit 20,000 shops in around 150 locations to collect over 100,000 prices, with much of the collection taking place at a set point in time, usually the second or third Tuesday of each month1. Around 160 items are collected centrally, for things where prices do not vary by location1.
Collection has been changing. For much of the grocery market, the ONS now uses scanner data, approximately 300 million price points derived from sales of over a billion units of products per month, replacing around 25,000 prices per month previously collected directly from shops2. Rail fares, second-hand cars and much of the grocery market use large alternative data sources in this way1.
The weights that decide how much each item matters come from household spending surveys. The Living Costs and Food Survey is a continuous survey of the expenditure patterns of private households based on a sample of around 6,000 households per annum1. The Northern Ireland Living Costs and Food Survey feeds the same purpose, with its information used to update the contents of the consumer inflation basket of goods and services11. The inflation basket and household spending are covered in detail elsewhere.
The basket of about 760 goods and services
The consumer price indices are compiled using a representative sample of approximately 760 goods and services, reviewed annually, and their prices are collected from approximately 20,000 outlets within the UK1. The basket includes items ranging from food to rents12. In the CPIH, the CPI and the Household Costs Indices, all categories of expenditure on which significant amounts of money are spent are arranged into 12 divisions13; in the RPI they are arranged into 14 groups, such as food, housing and motoring costs13.
The basket is updated so it keeps reflecting what people actually buy. The resulting indices are double chain-linked: first in January, to account for annual changes in the weights, and a further chaining step in February to account for changes in the basket of representative items, the goods and services aggregated up to form the class level of CPIH13. The 2026 weights for CPIH and CPI were calculated using national accounts household final consumption expenditure data for 20242.
The weights are plutocratic: each item's importance reflects total spending on it across the economy, so the spending of households that spend more carries more weight. Plutocratic weights are used to calculate the CPI, CPIH and RPI13. The ONS notes that CPIH therefore broadly reflects the experience of households around two-thirds of the way up the expenditure distribution13. The Household Costs Indices instead use democratic weights, based on the average household's share of expenditure, which is one reason they show different rates for different household groups14.
CPI, CPIH and RPI: how each is calculated
The three headline indices share a family resemblance but differ in method. Rates of change for CPIH and CPI are calculated from unrounded index levels, while rates of change for the RPI are calculated from the rounded published indices1. At the elementary aggregate level, stratum indices are calculated using predominantly the geometric mean for CPIH and CPI, and arithmetic means for the RPI1. The arithmetic mean tends to produce a higher measured rate, which is one reason RPI typically runs above CPIH; Which? notes CPIH is typically 0.8 percentage points lower than RPI6.
Coverage differs too. CPIH and CPI cover the expenditure of all private households, institutional households and visitors to the UK1. RPI's coverage is narrower and its methods older: RPI data are available back to 1947, re-referenced on several occasions since, and the first official release of consumer price inflation was produced in January 19561.
The status of each differs in the official statistics system. The ONS states plainly: "Accredited official statistic: CPIH and CPI, yes; RPI, no"1. The Retail Prices Index and its subcomponents do not meet the required standard for designation as accredited official statistics3.
"Accredited official statistic: CPIH and CPI, yes; RPI, no"
Reform of RPI is planned. From 2030 at the earliest, CPIH methods and data sources will be introduced into the RPI, and supplementary and lower-level RPI indices will be discontinued2. Which? reports that the RPI measure will be brought in line with the UK's official CPIH rate by 20306. Until then, RPI continues to be used in some legacy contracts, which is covered in RPI: where it is still used and its reform and in CPI or RPI: which inflation measure applies to you.
Why CPIH is the lead measure but CPI sets the target
CPIH has been the ONS's lead measure of inflation since 21 March 2017, chosen on economic principles because its coverage of housing costs makes it the more complete measure1. But the measure used in policy is CPI. The ONS notes that CPI "is used by the government for inflation targeting, and for uprating state pensions and benefits"1. The Bank of England confirms this: the Government asks it to target the CPI measure of inflation15. The 2% inflation target and how higher interest rates work to bring inflation down are explained in their own guides15.
CPI also drives increases elsewhere in personal finance:
- Public sector pensions increase in line with the CPI rate in the 12 months up to the previous September16.
- Pension Protection Fund compensation rises in line with CPI each year, up to 2.5 per cent a year for service accrued after 6 April 199717.
- The Financial Ombudsman Service adjusts its award limit each year in line with inflation as measured by CPI19.
- Help to Buy Wales uses the September CPI measurement and applies it to its interest rate rise every April20.
So a reader's own increases, whether a pension, a benefit or an award limit, are most likely to be tied to CPI, while the headline figure the ONS publishes first and treats as its lead measure is CPIH. How inflation sets increases to benefits, the State Pension and tax thresholds is covered in its own guide.
Rents and housing costs within the figures
Housing runs through the indices in several forms, and it is worth telling them apart. Actual rents paid by tenants are in CPI and CPIH as division 04.1, which rose by 4.2% in the 12 months to August 20262. Owner occupiers' housing costs, division 04.2, rose by 3.9% over the same period2. Council tax and rates, division 04.9, rose by 5.1%2. Electricity, gas and other fuels, division 04.5, rose by 6.0%2.
The ONS also tracks private rents separately through the Price Index of Private Rents (PIPR), which measures private rent inflation for new and existing tenancies21. PIPR data are official statistics in development22. Private rents are covered in their own guide.
For social renters, CPI feeds directly into rent increases. Shelter explains that if the CPI is 3.2%, your rent can go up by 4.2%, because the rent-setting formula adds one percentage point to CPI23. The CPI is published every month, and social landlords use a specified September figure in their annual review23.
Rent experiences vary widely beneath the averages. ONS survey data reported by Which? found that 50.6% of privately rented properties in England experienced a price increase between February 2022 and February 2023, compared with 36% the year before, and of those that saw a rise, the average increase was 9.6%24. One in five surveyed properties saw a rent increase of 10% or more, 46.6% saw no change, and 2.8% saw a decrease24. In London, 66.8% had seen an increase, with the average rise highest there at 12%, and lowest in the West Midlands at 8.2%24.
Where CPIH does not match your own costs
CPIH is an average across the whole economy, and no individual household is the average. Because plutocratic weights are used, CPIH broadly reflects the experience of households around two-thirds of the way up the expenditure distribution13. If you spend a larger than average share on divisions rising quickly, such as housing and household services at 4.3%, or energy at 6.0%, your own costs rise faster than 3.3%2. If you spend heavily on things rising slowly, such as food at 1.3%, your costs rise more slowly2.
Some individual classes move very differently from the headline. House contents insurance fell by 11.0% over the 12 months to August 2026, while health insurance rose by 7.8% and restaurants and cafes by 4.6%2. Package holidays rose by just 0.2%2. A household whose spending is concentrated in any one of these will have a personal rate far from the headline.
The Household Costs Indices exist precisely to show this variation, using democratic weights and a payments approach that includes items like mortgage interest, student loan repayments and full insurance premiums13. In June 2026, the gap between the all-households HCI and CPI annual rates was 0.2 percentage points7. Outright owner occupiers, for example, experienced a cumulative HCI inflation rate of 31.7% over the five years to December 202525.
Where a financial product has been sold on the back of inflation expectations and goes wrong, the Financial Ombudsman Service can consider complaints, including where a product was not suited to the complainant's circumstances or its risks were not properly explained26. Free, impartial help on money questions is available from MoneyHelper, and the ombudsman handles complaints about financial firms at no cost to the consumer.
Sources26 cited
- Consumer price inflation, includes all 3 indices CPIH, CPI and RPI QMI Office for National Statistics, 25 March 2026
- Consumer price inflation, August 2026 Office for National Statistics, 16 September 2026
- Consumer price inflation, July 2026 Office for National Statistics, 19 August 2026
- Consumer price inflation, June 2026 Office for National Statistics, 22 July 2026
- CPI monthly rate 12.5: Insurance Office for National Statistics, 16 September 2026
- RPI inflation reform: what it means for pensions, student loans, rail fares and more Which?, 29 November 2020
- Household Costs Indices for UK household groups, April to June 2026 Office for National Statistics, 28 August 2026
- Consumer price inflation, August 2026 Office for National Statistics, 16 September 2026
- Consumer price inflation, August 2026 Office for National Statistics, 16 September 2026
- FSCS consumer research: impact of rising cost of living on finances and pensions Financial Services Compensation Scheme, March 2023
- Northern Ireland Living Costs and Food Survey NISRA, 2026
- Cost of living tracker Trust for London, July 2025
- Calculating the Household Costs Indices Office for National Statistics, 28 May 2026
- Household Costs Indices for UK household groups, October to December 2025 Office for National Statistics, 26 February 2026
- How do higher interest rates help to lower inflation? Bank of England, 11 May 2023
- Annual pension increase NHS Scotland Pensions, 2026
- Useful terms and acronyms Pension Protection Fund, 4 May 2021
- Will my payments increase? Pension Protection Fund, 26 September 2026
- Increase in award limits 2024-25 Financial Ombudsman Service, 13 March 2024
- Fuel poverty modelled estimates Wales, October 2024 Welsh Government, October 2024
- Private rent and house prices, UK, August 2026 Office for National Statistics, 19 August 2026
- Private rent and house prices, UK, March 2026 Office for National Statistics, 25 March 2026
- Rent in a council or housing association home Shelter England, 28 June 2026
- Rents hiked on the majority of homes in the last year: what are your rights? Which?, 2 April 2023
- Household Costs Indices for UK household groups, January to March 2025 Office for National Statistics, 29 May 2025
- Capital protected structured investments Financial Ombudsman Service, 26 September 2026




 MoneyHelperFree, impartial money and pensions guidance, set up by government
 Citizens AdviceFree advice on money, consumer and legal problems in England and Wales
 GOV.UKOfficial information on tax, benefits and government services
 StepChangeFree debt advice and solutions from a charity
 FSCSProtects your money if a bank, insurer or investment firm fails