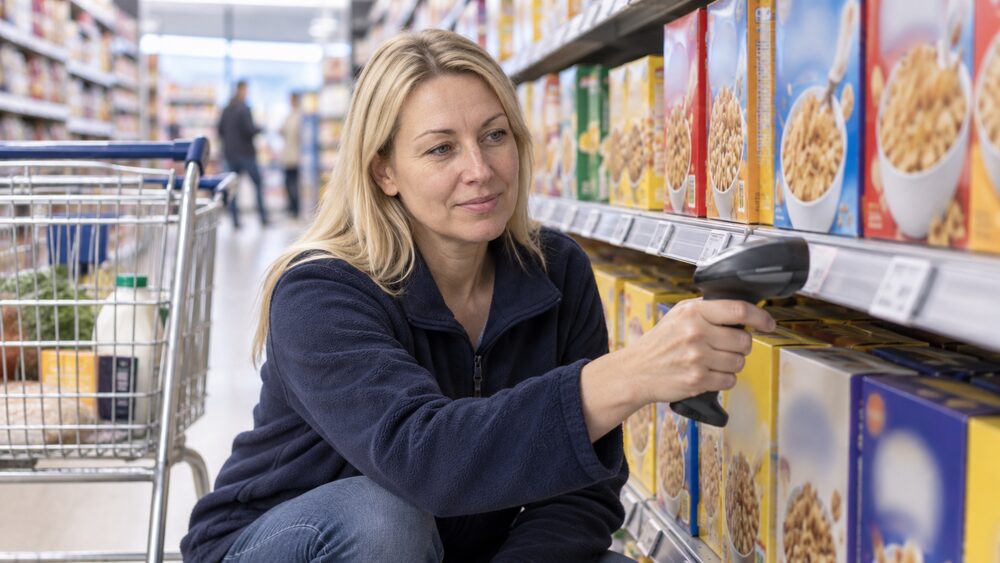
When the ONS reports that inflation was, say, 3.1% in the 12 months to July 20261, that number rests on a very concrete piece of machinery: a basket of around 760 goods and services, priced month after month across the UK2. The basket is not a literal shopping trolley. It is a representative sample of the things households buy, from bread and bus fares to streaming subscriptions and second-hand cars, chosen so that the combined price movement of the sample tracks the movement of prices across the whole economy.
Each month around 180,000 individual price quotations are collected2. Some are gathered in person by price collectors visiting shops, and a growing share now arrives as large datasets direct from retailers and other sources. Every item in the basket is then given a weight, based on how much households spend on it, so that a price rise in something people buy every week moves the headline figure more than a rise in something bought rarely.
This page explains how that system works: what is in the basket, how prices are collected, how the weights are set, how the basket changes each year, and where the limits of the whole approach lie. It also explains why the inflation you feel in your own household can differ from the official number.
What the inflation basket is: around 760 goods and services
The consumer price indices are compiled using what the ONS describes as "a large and representative sample of over 760 goods and services, and their prices", collected each month from around 20,000 outlets within the UK2. The basket is reviewed annually, so items drop out when spending on them falls away and new ones enter as spending habits shift. The aim is that the basket always reflects what a typical household actually buys, not what it bought five years ago.
The basket is not a list of every product sold in the UK. It is a sample, structured so that each item stands in for a wider category of spending. A particular loaf of bread or pair of jeans is priced not because that exact product matters to everyone, but because its price movement is assumed to represent the movement of similar products. That is why the basket can be around 760 items rather than hundreds of thousands: the sample is drawn to be representative, and the ONS states the indices are compiled using "broader coverage" alongside the item-level collection2.
The headline figures that come out of this process are familiar from the news. The Consumer Prices Index including owner occupiers' housing costs (CPIH), the ONS's lead measure, rose by 3.1% in the 12 months to July 20261. Within that, goods and services moved differently: the CPIH services annual rate stood at 3.6%, while the goods rate was lower1. The CPI and CPIH page explains those measures in more detail.
How prices are collected: about 180,000 quotes a month
The sample size for the consumer price indices is approximately 180,000 price quotations per month2. That total is assembled from several streams. Local price collectors visit 20,000 shops in around 150 locations to collect over 100,000 prices2. A further set of items, around 160 in total, is collected centrally rather than by local collectors, because their prices are the same everywhere or are best gathered from a single national source2.
Much of the price collection takes place at a set point in time, which is usually the second or third Tuesday of each month2. Fixing the day keeps the comparison consistent: prices for the same item are observed at roughly the same point in every month, so the measured change between months reflects price movement rather than timing.
From collection day to publication, the process runs on a fixed monthly cycle.
Collection does not always run perfectly. During the COVID-19 pandemic, reduced availability of products meant some series were based on less than half the number of quotes used in February 2020, which the ONS described as the most recent "normal" collection3. The pandemic is behind us, but the episode illustrates a general truth: the indices depend on products being available to price, and disruptions show up in the data.
Scanner and other large data sources for groceries, rail fares and used cars
Not all prices are collected by someone walking into a shop. Rail fares, second-hand cars and much of the grocery market now use large alternative data sources, with the remainder of the grocery market still collected in other ways2.
The biggest change in recent years is grocery scanner data. With the February 2026 index, published on 25 March 2026, the ONS introduced scanner data covering approximately 50% of the grocery market1. Instead of collecting 25,000 prices per month directly from shops by price collectors, the ONS now uses approximately 300 million price points derived from sales of over a billion units of products per month3. The same change appears in the June 2026 figures, which describe the same 300 million price points and the 50% grocery coverage4, and in the August 2026 bulletin5.
The scale of that shift is worth pausing on. A price collector can note the shelf price of one product in one shop. Scanner data records the prices actually paid, across every transaction the retailer processes, weighted by real sales. That means the measured price of groceries now reflects what customers buy in practice, including the effect of promotions and switching between products, rather than a fixed sample of shelf prices.
The Household Costs Indices, a separate set of measures covering different household groups, have gone through the same transition: the ONS states that for the grocery share covered, it uses approximately 300 million price points per month in place of around 25,000 prices previously collected by price collectors6. The Household Costs Index page covers those measures in full.
How household spending decides what each item counts for
Collecting prices is only half the job. Each item in the basket has to be given a weight, so that the index reflects how much households spend on it. A 10% rise in the price of something that takes a large share of spending matters far more to the headline than a 10% rise in something bought once a decade.
For the headline CPIH and CPI, the weights come from national accounts data on household spending. The 2026 weights for CPIH and CPI were calculated using national accounts household final consumption expenditure (HHFCE) data for 2024, with a first update alongside the January indices and a second with the February indices5.
The Household Costs Indices take a different approach to weighting, and the difference matters for how the two sets of figures behave. For the HCIs, the weight of each component in a household group's "fixed basket" is based on the average household's share of expenditure, a method the ONS calls "democratic" weights7. This treats each household equally when setting the weights, rather than weighting by total spending, which gives high-spending households more influence. The same democratic weighting is described in the HCI methodology8 and in the April to June 2026 HCI release6.
The effect of weighting choices shows up in the figures. Overall UK household costs, as measured by the Household Costs Index, rose by 3.6% in the year to December 2025, while costs for both low-income (Decile 2) and high-income (Decile 9) households increased by 3.7%7. Different groups face different baskets in practice, and the HCIs are the ONS's way of showing that.
The Living Costs and Food Survey behind the weights
The spending information that feeds the weights comes from the Living Costs and Food Survey (LCF), a continuous survey of the expenditure patterns of private households based on a sample of around 6,000 households per annum2. The household spending page covers the survey and its spending results in detail.
The LCF is a voluntary sample survey of private households. Each individual in a selected household is asked to complete a household interview and then maintain a spending record, an expenditure diary, for two weeks9. In Great Britain, 639 postal sectors are randomly selected and households are drawn from within them; the Northern Ireland sample is drawn as a random sample of addresses from the Land and Property Services Agency list10.
Achieved sample sizes have been lower than the design figure. The LCF achieved sample size for FYE 2024 was approximately 4,210 households11, and for FYE 2025 approximately 5,000 households9. A planned sample boost to 30,000 households from April 2026 is pending financial approvals11. In Northern Ireland, where the survey has run since 2008, a systematic random sample of 1,000 households is selected each year from the NISRA Address Register, and each household member aged 16 and over is invited to take part12. NISRA states the information collected is used to update the contents of the consumer inflation basket of goods and services12.
Response rates are a real constraint. The overall response rate for the LCF in FYE 2017 was 45% in Great Britain and 45% in Northern Ireland, where 389 households gave full interviews10. The ONS also removes households from the data used for some purposes: households reporting negative expenditure, and households spending 80% or more of total expenditure on a single category, are excluded, removing around 0.5% of the total sample8.
The survey data also arrive with a lag. The LCF data used in the HCI methodology are at a lag of two years from the reference period and are based on a calendar year8. For example, the 2023 index weights were based on expenditure of LCF households surveyed between January 2021 and December 20218. The ONS's family spending bulletins are compiled entirely from the LCF results13, and the ONS has also updated the LCF non-response weights in line with Census 2021, a change that reduced average household total expenditure by approximately 1.5%11.
The basket is reviewed every year
The basket of around 760 goods and services is reviewed annually2. The review is what keeps the indices tethered to real spending: as households buy less of one thing and more of another, items leave and enter the basket, and the weights are refreshed from the latest spending data.
The survey behind the basket is itself being extended. Questions on outstanding balances on loans and hire purchases, alongside questions requesting the annual percentage rate, were added to the LCF from the first quarter of 2025 (January to March), and the ONS expects to use these survey variables to derive household-level loan interest repayments with the 2027 weights update8. That points to the weights becoming more responsive to borrowing costs over time.
Inflation-linked increases elsewhere in the economy also follow an annual rhythm tied to these measures. The inflation-linked increases page explains how figures such as the CPI feed into benefit and pension uprating.
CPI, CPIH and RPI: how each one averages the same prices
The same underlying prices feed three published measures, and the differences between them come from what each includes and how each averages the prices. At the elementary aggregate level, stratum indices are calculated using predominantly the geometric mean for the CPIH and CPI, and arithmetic means for the RPI2. The geometric mean and the arithmetic mean can give different answers from the same price data, and this is one reason the RPI tends to run higher than the CPI.
The three measures also differ in coverage. The CPIH is the ONS's lead measure of inflation, based on economic principles, and it is the most comprehensive measure because it includes owner occupiers' housing costs and Council Tax, which are excluded from the CPI2. The CPI was first published in 1997 as the Harmonised Index of Consumer Prices (HICP), a consistent measure allowing international comparison2. The RPI is the oldest of the three, providing estimates of inflation from 1947 onwards, with the first official release of consumer price inflation produced in January 19562.
The three measures share the same collected prices but differ in coverage and averaging.
There is a further technical difference in how changes are calculated. Rates of change for the CPIH and CPI are calculated from unrounded index levels, while rates of change for the RPI are calculated from the rounded published indices2. The RPI also carries a formal quality warning: the RPI and its subcomponents do not meet the required standard for designation as accredited official statistics3. The RPI page covers where it is still used, and the CPI or RPI comparison page sets out which measure applies where.
Recent figures illustrate the measures side by side. CPIH rose by 0.5% in August 2026 on a monthly basis, compared with a rise of 0.3% in August 20253, and the CPI all-goods index rose by 2.7% in the 12 months to August 2026, up from 2.2% the previous month3.
When the figures are published
Publication takes place four or five weeks after collection, and the ONS states this has never been delayed or missed2. The July 2026 consumer price inflation bulletin, for example, was released on 19 August 20261. The practice of advance notice of publication dates, with a minimum of 18 months to a maximum of 30 months, will be maintained in future years2.
One exception to the release schedule exists. The Bank of England was granted exceptional pre-release access to an estimate of consumer price inflation data at 10:00am on Monday 14 September 2026, ahead of a Monetary Policy Committee meeting3. The inflation figures page lists the release pattern in detail, and the Monetary Policy Committee page explains why the Bank watches the figures so closely.
The statistics carry formal quality credentials. Consumer price inflation statistics are accredited official statistics, independently reviewed by the Office for Statistics Regulation in July 2017, and they comply with the standards of trustworthiness, quality and value in the Code of Practice for Statistics1.
Why your own inflation rate can differ from the official figure
The headline rate is an average, and no household is average. Household-specific price indices are not currently available because price data are collected from retailers rather than from households8. That is a structural point worth understanding: the ONS knows what shops charged, and it knows what households said they spent in the LCF, but it does not track the actual purchases of individual households, so it cannot produce a personal inflation figure for you.
What it can do is measure inflation for groups. The Household Costs Indices show costs for household groups by income, tenure and other characteristics, using democratic weights7. The gap between groups can be material: in the year to March 2024 there was a 1.1 percentage point gap between the HCI rates for high-income (Decile 9) and low-income (Decile 2) households, narrowed from 1.4 percentage points in October and November 202314. Within that gap, miscellaneous goods and services contributed 0.13 percentage points14.
Different groups faced different price rises for the same basket of pre-2020 purchases.
The practical message is that the official figure is a benchmark, not a description of any particular household. If your spending is concentrated in categories whose prices rose faster than average, your cost of living rose faster than the headline, and the reverse is equally true. The Household Costs Index and the CPIH or Household Costs Index comparison pages go further into how the group measures are built.
Limits of the basket: sample sizes, lags and gaps
Every statistical system has limits, and the inflation basket is no exception. Knowing them helps in reading the figures honestly.
- Sample size. Around 180,000 price quotations a month is a large sample, but it is still a sample of a far larger universe of transactions, and the LCF behind the weights achieved roughly 4,210 households in FYE 20242.
- Response rates. The LCF response rate was 45% in FYE 2017 in both Great Britain and Northern Ireland10, and households that do not respond may differ from those that do.
- Lags. The LCF data used arrive two years after the reference period8, so the spending weights always describe the past, and the 2023 index weights rested on spending surveyed between January and December 20218.
- Availability shocks. During the pandemic some series were based on less than half the number of quotes used in February 20203, showing how disruption can thin the data.
- Measure quality. The RPI does not meet the standard for accreditation3, and reform is planned: from 2030 at the earliest, CPIH methods and data sources will be introduced into the RPI, and its supplementary and lower-level indices will be discontinued1.
Against those limits, the core statistics carry strong safeguards: they are accredited official statistics, independently reviewed, and published on a schedule that has never been missed2. The inflation page explains what the headline figure means for your money, and the 2% inflation target page explains why the Bank of England aims to keep it there.
Sources15 cited
- Consumer price inflation, UK: July 2026 ONS, 19 August 2026
- Consumer price inflation, CPIH, CPI and RPI: QMI ONS, 25 March 2026
- Consumer price inflation, UK: August 2026 (PDF) ONS, 16 September 2026
- Consumer price inflation, UK: June 2026 ONS, 2026
- Consumer price inflation, UK: August 2026 ONS, 2026
- Household Costs Indices for UK household groups: April to June 2026 ONS, 28 August 2026
- Household Costs Indices for UK household groups: October to December 2025 (PDF) ONS, 26 February 2026
- Calculating the Household Costs Indices: methodology ONS, 28 May 2026
- Family spending in the UK: April 2024 to March 2025 ONS, 11 June 2026
- Family spending in the UK: financial year ending 2017 ONS, 18 January 2018
- Family spending in the UK: April 2023 to March 2024 ONS, 2024
- Northern Ireland Living Costs and Food Survey NISRA, 2026
- Differences between ONS household expenditure statistics ONS, 6 March 2026
- Household Costs Indices for UK household groups: January to March 2024 (PDF) ONS, 30 May 2024
- Cost of living tracker Trust for London, 2025



 MoneyHelperFree, impartial money and pensions guidance, set up by government
 Citizens AdviceFree advice on money, consumer and legal problems in England and Wales
 GOV.UKOfficial information on tax, benefits and government services
 StepChangeFree debt advice and solutions from a charity
 FSCSProtects your money if a bank, insurer or investment firm fails