
The most recent UK inflation figures, published by the Office for National Statistics (ONS) in September 2026, show the Consumer Prices Index including owner occupiers' housing costs (CPIH) rose by 3.3% in the 12 months to August 2026, up from 3.1% in July1. The Consumer Prices Index (CPI), the measure the Government asks the Bank of England to target, rose by 3.1% over the same period, up from 2.9% the previous month1. On a monthly basis, CPIH rose by 0.5% in August 2026, compared with a rise of 0.3% in August 20251.
Inflation figures are published every month, four or five weeks after prices are collected, and the ONS states publication has never been delayed or missed2. The next release is scheduled for 21 October 2026, covering the 12 months to September3. This page explains what each measure covers, how the figures are put together, and what the current numbers mean for household budgets.
CPIH inflation: 3.3% in the 12 months to August
The headline figure in each monthly release is CPIH, the ONS lead measure of inflation, based on economic principles5. In the 12 months to August 2026, CPIH rose by 3.3%, and the CPIH index value stood at 143.4, where 2015 equals 1006. The monthly movement was 0.5%, which compares with 0.3% in the same month a year earlier1.
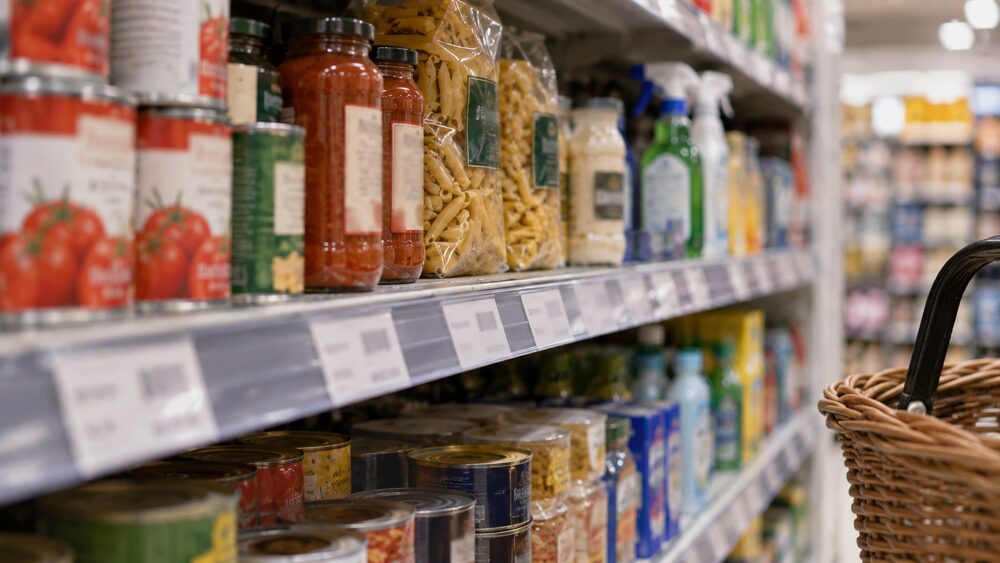
Within the overall figure, different parts of the basket moved at very different speeds. The 12-month rate for housing and household services was 4.3% in August 2026, up from 4.1% in July, making it one of the fastest-rising divisions1. Food and non-alcoholic beverages rose by 1.3%, unchanged from July1. Core CPIH, which excludes energy, food, alcohol and tobacco and is watched as a guide to underlying pressure, rose by 2.9%, unchanged from the previous month1.
The picture a month earlier was slightly cooler. In the 12 months to July 2026, CPIH rose by 3.1% and CPI by 2.9%5. In June 2026, CPIH was 2.8%7, so the trend across the summer of 2026 has been upward. The ONS also publishes a split between goods and services: in the year to July 2026, the CPIH goods rate rose from 1.7% to 2.2%, while the CPIH services rate was unchanged at 3.6%5. By August, the CPI goods annual rate had risen from 2.2% to 2.7%1.
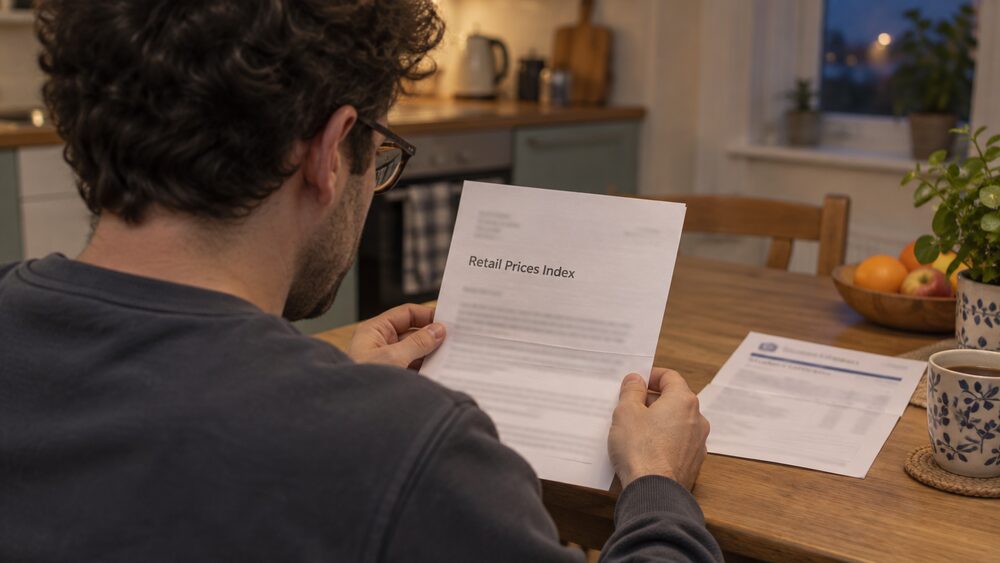
The RPI, an older measure still used in some contracts, stood at 3.4% in August 20261. How CPIH, CPI and RPI differ, and why the numbers diverge, is covered below.
When the next inflation figures are published
Consumer price inflation figures come out monthly. The August 2026 bulletin was released on 16 September 2026, and the next release, covering September 2026, is scheduled for 21 October 20263. Publication takes place four or five weeks after the price collection period, which is usually the second or third Tuesday of each month2.
The ONS announces release dates far in advance. Its stated practice is to give a minimum of 18 months and a maximum of 30 months' notice of publication dates, and it states that publication has never been delayed or missed2. That reliability matters because financial markets, the Bank of England and the Government all act on these figures: the CPI is used to set the operational inflation target for UK monetary policy and to uprate working-age benefits and tax credits5.
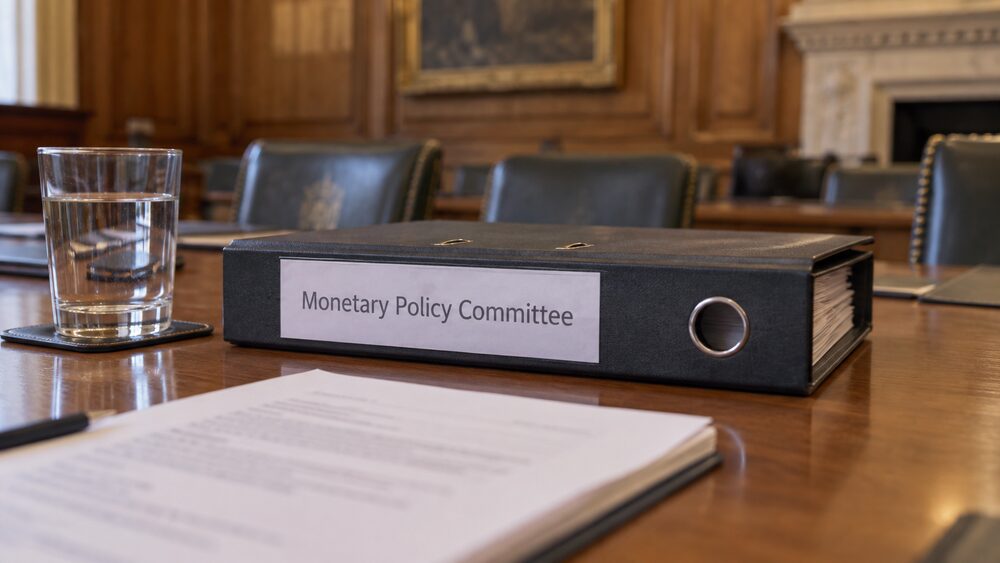
One point of process is worth knowing. The Bank of England was granted exceptional pre-release access to an estimate of consumer price inflation data at 10:00am on Monday 14 September 2026, ahead of a Monetary Policy Committee meeting, before the figures were published3. Exceptional access of this kind is granted only in specific circumstances and is disclosed in the bulletin.
Related house price and private rent figures follow their own timetable. The UK House Price Index is published on the second or third Wednesday of each month, with Northern Ireland figures updated quarterly; the August 2026 edition was scheduled for 9:30am on Wednesday 21 October 20268.
CPIH, CPI and RPI: what each measure covers
The three measures in each monthly release answer slightly different questions, and the differences explain why their numbers never match.
CPIH is the most comprehensive measure. It includes owner occupiers' housing costs and Council Tax, which are excluded from the CPI2. The ONS describes CPIH as its lead measure of inflation, based on economic principles5, and it became the ONS lead inflation index on 21 March 20172. Owner occupiers' housing costs are measured using an approach called rental equivalence, which estimates what homeowners would pay to rent their own home, and housing costs currently account for 16.5% of the expenditure weight of CPIH2.
CPI excludes those housing costs. It is the measure the Government asks the Bank of England to target9, and it is used to uprate working-age benefits and tax credits5. It is also the only UK inflation index currently designated as an Accredited Official Statistic10. The CPIH and CPI both cover the expenditure of all private households, institutional households and visitors to the UK2.
RPI is the oldest of the three and is no longer accredited: the ONS lists CPIH and CPI as accredited official statistics, and RPI as not2. RPI is still used in some index-linked contracts and its annual rate was 3.4% in August 20261. One technical reason RPI tends to run higher is that rates of change for CPIH and CPI are calculated from unrounded index levels, while RPI rates are calculated from the rounded published indices2.
The UK inflation target was switched to a CPI basis in December 2003, when the Chancellor announced the target would be based on the HICP (the EU-harmonised measure that CPI follows), replacing the RPI excluding mortgage interest payments2.
How the ONS measures prices each month
The inflation figures are built from a large monthly exercise. The ONS compiles its consumer price indices using a representative sample of approximately 760 goods and services, reviewed annually, with prices collected from approximately 20,000 outlets across the UK2. Local price collectors visit 20,000 shops in around 150 locations to collect over 100,000 prices, and around 160 items are collected centrally2. In total, the sample size is approximately 180,000 price quotations per month2.
Much of the price collection takes place at a set point in time, usually the second or third Tuesday of each month2. Some series use large alternative data sources rather than collectors in shops: this includes rail fares, second-hand cars and much of the grocery market2.
The weights that decide how much each item influences the overall figure come from household spending surveys, principally the Living Costs and Food Survey, a continuous survey of the expenditure patterns of private households based on a sample of around 6,000 households per annum2. At the elementary aggregate level, stratum indices are calculated predominantly using the geometric mean for CPIH and CPI, and arithmetic means for the RPI2.
The figures are accredited official statistics, independently reviewed by the Office for Statistics Regulation in July 20171. The CPIH series itself is relatively young: the official CPIH series (based on 2015 equals 100) started in 20132, and the CPIH series only began in January 200611.
Housing costs and rents in the inflation figures
Housing is where the measures diverge most, and where many households feel inflation most sharply. The CPIH housing and household services division rose by 4.3% in the 12 months to August 2026, up from 4.1% in July1. On the CPI basis, which excludes owner occupiers' housing costs but includes rents and other housing services, the housing and household services rate was 4.9%, up from 4.6%1. The owner occupiers' housing costs component itself rose by 3.7% in the year to July 20265.
Private rents are tracked separately in the ONS private rent and house prices release. Average UK monthly private rent increased by 3.8%, to £1,400, in the 12 months to August 2026 (provisional estimate)12. In England, average rents increased to £1,459 (4.0%) over the same period13. The rent figures have been gradually accelerating through 2026: UK private rents rose 3.5% to £1,374 in the year to February 202614, 3.3% to £1,388 in the year to June 202615, and London's annual rent inflation rose to 3.5% in the 12 months to August 2026, up from 3.0% in July12.
House prices are a separate statistic from consumer price inflation, since buying a home is treated as an asset purchase rather than consumption. The UK House Price Index measures house price inflation and is a National Statistic16; it is calculated by the ONS and Land and Property Services/Northern Ireland Statistics and Research Agency using a hedonic regression model drawing on sources including HM Land Registry's Price Paid Dataset17. Average UK house prices increased by 2.0%, to £272,000, in the 12 months to June 2026 (provisional estimate)18.
Household spending data shows how these costs have landed on budgets. Expenditure on net rent increased by £7.00 (14%) in nominal terms in the financial year ending 2025, but only by £3.30 (6%) in real terms once inflation is accounted for19.
How inflation has moved since the 11.1% peak
The recent history of UK inflation is unusually dramatic. The annual rate of Consumer Price Inflation reached a peak of 11.1% in October 2022, a 41-year high20. The rise was driven by strong global demand for consumer goods as the economy recovered from the Covid-19 pandemic, supply chain disruption, and soaring energy and fuel prices21.
Before the surge, inflation was under 0.5% in February 202122. From the October 2022 peak, CPI gradually reduced to reach the Bank of England's target rate of 2% by June 202422, and fell further to a low of 1.7% in September 202423. It then rose again to a post-election peak of 3.8% in July, August and September 2025, before falling back slightly to 3.6% in October 202523. Scottish Government analysis recorded CPI inflation at 3.8% in August 2025 and 2.6% in March 202524.
Through 2026 the rate has climbed again: 2.6% in June25, 2.9% in July25 and 3.1% in August1. Measured on CPIH, the path was 2.8% in June 20267, 3.1% in July5 and 3.3% in August1.
Food prices followed an even sharper path. Annual food price inflation reached 19.2% in March 2023, the highest rate of increase in food prices since 197721. The share of adults reporting increases to their cost of living, compared with the previous month, gradually declined from 80% in October 2022 to 53% in October 202427.
The 2% target and how the UK compares with Europe
The Government sets the Bank of England a target of getting inflation to 2%4. The Bank raises interest rates to bring inflation down: it describes raising interest rates as the best way it has to make sure inflation comes down and stays low9. The CPI is the measure the Government asks the Bank to target9.
Against that 2% target, the current CPI rate of 3.1% is above where the Bank aims. The path back has been uneven: the target was reached in June 202422, but the rate has since risen again. The Bank's forecast published in December 2024 was for the inflation rate to rise to 2.8% in 2025 before gradually easing back towards 2% in 202721.
Internationally, the UK has been running hotter than its neighbours. The UK's CPI inflation rate of 3.1% in August 2026 was higher than the first, or "flash", estimates of inflation for France (2.7%) and Germany (2.9%)1. In July 2026, the UK rate of 2.9% was higher than France's flash estimate (2.4%) and slightly above Germany's (2.8%)5. In June 2026, the UK's 2.6% was lower than the EU rate (2.9%) but higher than France (2.0%) and Germany (2.4%)7.
One contributor to the UK's relatively high price level is energy. UK domestic electricity prices were 18% above the EU average in the second half of 202528.
What rising prices mean for your money
Inflation figures matter because they describe how far money stretches. UK consumer prices in 2026 are over 30% higher than at the start of 202129. Average house prices in the UK have risen by more than 30% since the Lifetime ISA was introduced in April 2017, according to the UK House Price Index30.
For household budgets, the official figures show spending rising in cash terms but much less after inflation. Average weekly household expenditure showed a real-terms increase of £35.10 (5%) in the financial year ending 2025 after accounting for inflation19. In the financial year ending 2022, the real-terms increase was £28.80 (6%)31.
Inflation also feeds directly into incomes and benefits through uprating. The 10.1% uprating of inflation-linked cash benefits, including Universal Credit standard allowances, the State Pension and disability benefits, was reflected in household income figures for the financial year ending 202432. The CPI is the measure used to uprate working-age benefits and tax credits5.
Your own experience can differ from the headline for a simple reason: the official rate is an average across roughly 760 goods and services, weighted by average household spending2. If your spending is concentrated in the faster-rising categories, such as housing and household services (4.3% in August 2026)1 or private rents (3.8% across the UK, 4.0% in England)12, your personal cost of living rises faster than 3.3%. The Household Costs Index, which measures inflation as different household groups experience it, showed an all-households annual rate of 4.4% in the year to March 2024, compared with a CPI annual rate of 3.2% over the same period33, and an annual CPI rate of 3.4% for all households in the year to December 202526.
For savers, inflation is the benchmark that real returns are measured against: cash earning less than the inflation rate loses purchasing power over time. For borrowers, the Bank of England's response to inflation, through Bank Rate, is what feeds through to mortgage and loan costs9.
Sources33 cited
- Consumer price inflation, UK: August 2026 Office for National Statistics, 2026
- Consumer price inflation, UK: QMI Office for National Statistics, 2026
- Consumer price inflation, UK: August 2026 (PDF) Office for National Statistics, 2026
- Current interest rate explainer Bank of England, 2026
- Consumer price inflation, UK: July 2026 Office for National Statistics, 2026
- Inflation and price indices Office for National Statistics, 2026
- Consumer price inflation, UK: June 2026 Office for National Statistics, 2026
- UK House Price Index for July 2026 HM Land Registry, 2026
- How do higher interest rates help to lower inflation? Bank of England, 2023
- Price and Inflation Indices Quality and Methodology Report NISRA, 2026
- FSCS consumer research: impact of rising cost of living FSCS, 2023
- Private rent and house prices, UK: August 2026 Office for National Statistics, 2026
- Private rent and house prices, UK: latest Office for National Statistics, 2026
- Private rent and house prices, UK: March 2026 Office for National Statistics, 2026
- Private rent and house prices, UK: June 2026 Office for National Statistics, 2026
- UK House Price Index data downloads, June 2026 HM Land Registry, 2026
- UK House Price Index for February 2026 HM Land Registry, 2026
- Private rent and house prices, UK: September 2026 Office for National Statistics, 2026
- Family spending in the UK: April 2024 to March 2025 Office for National Statistics, 2025
- Research briefing: UK inflation House of Commons Library, 2026
- Understanding the cost of living crisis in Scotland Scottish Government, 2025
- Understanding the cost of living crisis in Scotland, page 2 Scottish Government, 2025
- Budget 2025: economic and fiscal forecasts House of Lords Library, 2025
- Scottish Economic Insights, September 2025, page 6 Scottish Government, 2025
- Scottish Economic Insights, September 2026, page 6 Scottish Government, 2026
- Household Costs Indices for UK household groups: October to December 2025 Office for National Statistics, 2026
- Understanding the cost of living crisis in Scotland, page 6 Scottish Government, 2025
- Research briefing: energy prices House of Commons Library, 2026
- The cost of living: ongoing pressures and recent developments Senedd Research, 2026
- Treasury Committee report on savings House of Commons Treasury Committee, 2026
- Family spending in the UK: April 2021 to March 2022 Office for National Statistics, 2022
- The effects of taxes and benefits on household income: 2024 Office for National Statistics, 2024
- Household Costs Indices for UK household groups: January to March 2024 Office for National Statistics, 2024



 MoneyHelperFree, impartial money and pensions guidance, set up by government
 Citizens AdviceFree advice on money, consumer and legal problems in England and Wales
 GOV.UKOfficial information on tax, benefits and government services
 StepChangeFree debt advice and solutions from a charity
 FSCSProtects your money if a bank, insurer or investment firm fails