
The average UK household spent £676.60 a week in the financial year ending March 2025, according to the Office for National Statistics (ONS). That is a rise of £53.30 a week, or 9%, in cash terms on the year before1. After accounting for inflation, the real-terms increase was smaller: £35.10 a week, or 5%2.
That single number comes from the Family Spending report, which the ONS compiles entirely from the results of the Living Costs and Food Survey (LCF), a long-running study of what real households buy3. The figures matter beyond curiosity: the same survey decides how much weight each category of spending gets in the UK's inflation measures, so what surveyed households put in their shopping trolleys eventually shapes the inflation rate everyone reads about.
Average UK household spending: £676.60 a week
The headline figure of £676.60 a week covers everything a household spends: housing, food, transport, bills, leisure and everything else. It is an average across all households, from single pensioners to families with several earners, which is why the spread around it is wide. The richest fifth of households spent £1,083.60 a week in FYE 2025, well over half as much again as the average across all households1.
The recent trend is a story of a fall and a partial recovery. Average weekly spending was £587.90 in the financial year ending March 2020, the last full year before the pandemic5. By FYE 2022 it had fallen to £528.80, which was £78.80, or 13%, below pre-pandemic levels in real terms6. The recovery since then has been real but incomplete: even after the £35.10 real-terms rise in FYE 2025, total average weekly household expenditure remained £75.60, or 10%, per week lower than in FYE 20202.
The comparison with FYE 2020 is a useful reality check on the cash figure. A household spending £676.60 a week in 2025 is not buying a fifth more than one spending £587.90 in 2020, because prices rose sharply in between. In real terms, spending has climbed back towards, but not reached, its pre-pandemic level2. For more on how inflation changes what a figure is worth, see what inflation is and how it affects your money.
Where the money goes: housing, fuel and power take the biggest share
Housing is the largest call on the average household's budget, and by a clear margin. In FYE 2025, households spent £118.40 a week on housing (net), fuel and power, which is 18% of total expenditure and a real-terms rise of £5.60, or 5%, on the year before1. The same category led the table in FYE 2024 at £113.30 a week7, and in FYE 2022 at 17% of spending6, so the pattern has been consistent across the whole period of rising prices.
Transport is the second biggest proportional expense at 14% of spending, or £96.40 a week, with spending up by £8.10, or 9%, in FYE 20252. Food and non-alcoholic drinks also rose in real terms, by £1.60, or 2%, a week1.
How much of the budget housing takes depends heavily on income. The poorest fifth of households continued to spend the largest proportion of their total expenditure, 27%, on housing (net), fuel and power in FYE 20247, against 18% for all households. Housing costs eat a much bigger slice of a small budget, which is one reason the same rate of inflation is felt differently at different income levels, a point covered in the Household Costs Index.
Energy bills: up in cash terms, down after inflation
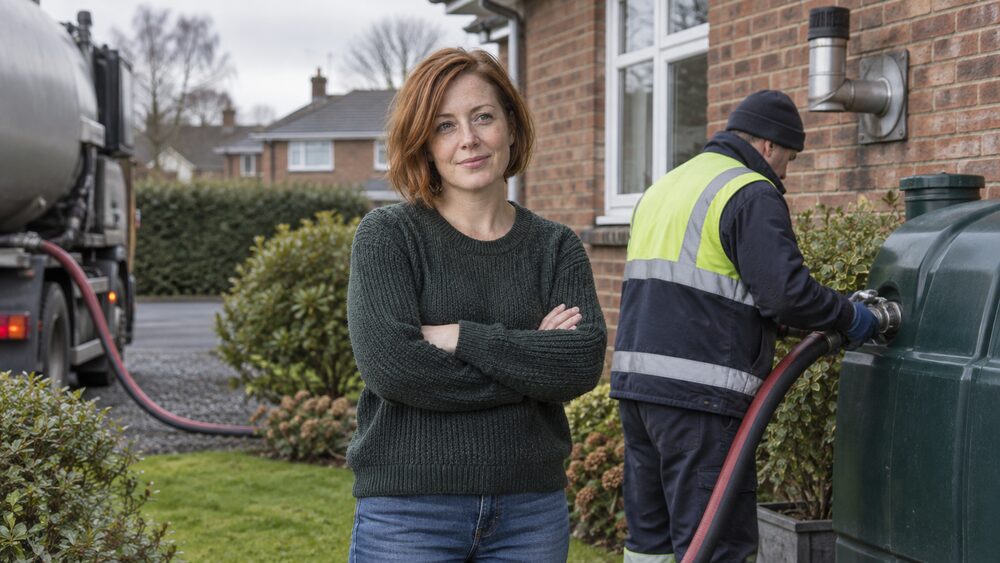
Energy spending has moved in two directions at once over recent years, and which one you see depends on whether the figures are adjusted for inflation. Between FYE 2022 and FYE 2024, households nominally increased their weekly spending on energy and fuel by £14.80, or 58%. After inflation, however, weekly energy spending fell by £3.50, or 8%7. In FYE 2025 the pattern reversed: energy expenditure rose by £2.20, or 7%, in real terms, despite a nominal decrease of £4.60, or 11%1.
The energy price cap sits behind much of this. The cap rose slightly, by 0.2%, in January 2026 to £1,758 per year for a typical household using electricity and gas and paying by direct debit8. The House of Commons Library reports average annual bills of £1,641 under the current cap, £1,663 under the July to September 2026 direct debit cap, and notes the April to June 2024 cap had fallen to £1,520 for customers with typical consumption levels9. How the cap is set is explained in the energy price cap.
Looking forward, the Budget announced measures aimed at reducing household energy bills by around £150 on average in Great Britain from April 2026, through changes to the renewables scheme10.
Rent and mortgage costs compared
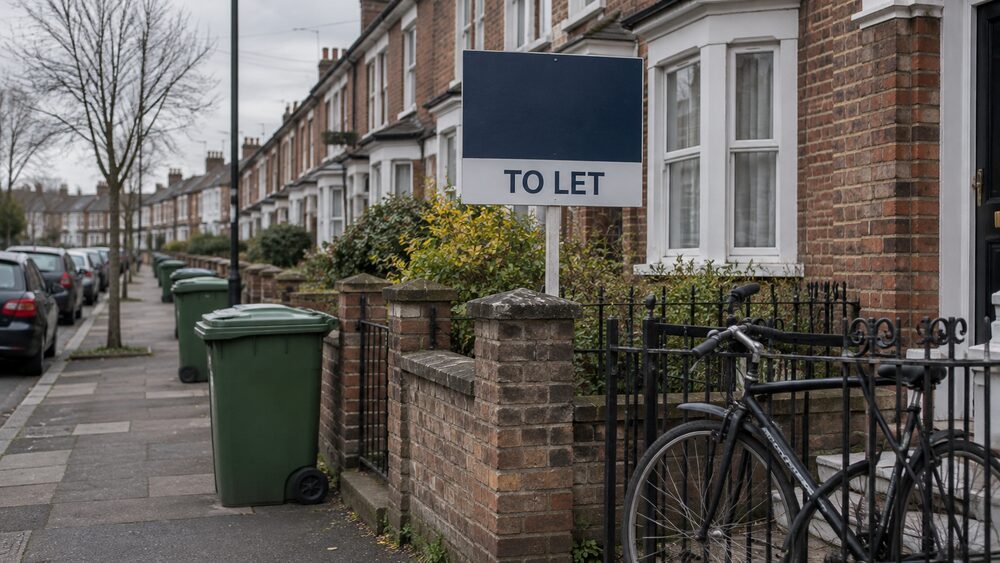
Renters and mortgaged households carry very different housing costs, and the official figures show the gap plainly. In Northern Ireland in 2022/23, the highest housing costs, £105 a week, were associated with the private rented sector, compared with £78 for social rented and £39 for owned with a mortgage, where only the interest component is counted11. A year earlier the equivalent figures were £105, £78 and £3612.
In England, the ONS measures affordability directly. In the financial year ending March 2024, private-renting households spent 36.3% of their income on an average-priced rented home: £1,232 monthly rent against £3,396 monthly income13. That share has climbed over time, from 26% in financial year 2021, when £730 of monthly rent was the equivalent of 26% of an average household income of £2,82514, and 26.1% in FYE 2022, at £795 rent against a £3,050 monthly income15.
More recent rent levels are higher still. The average UK monthly private rent in May 2026 was highest for detached properties at £1,572 and lowest for flats and maisonettes at £1,35116. For mortgaged households, the English Housing Survey reports a mean weekly mortgage payment of £17017. How a Bank Rate change feeds into mortgage payments is covered in Bank Rate and mortgages, and how rents are tracked in private rents.
How the Living Costs and Food Survey works
The Living Costs and Food Survey is a continuous survey of the expenditure patterns of UK private households, based on a sample of around 6,000 responding households a year4. The ONS's consumer price inflation statistics describe it the same way: a continuous survey based on a sample of around 6,000 households per annum18. Some form of household expenditure survey has been conducted each year in the UK since 195719, so the series is one of the longest-running household studies in the country.
The LCF is a voluntary sample survey of private households. Each individual in a selected household is asked to complete a household interview and to maintain a spending record for two weeks2. The results feed several publications at once: the Family Spending report is the primary output, giving detailed tables of average weekly expenditure per household in pounds, broken down by household characteristics and type of spend, including breakdowns by income group, household composition and region3.
The survey's income side is also used elsewhere. The Household Finances Survey, which produces the ONS's main household income statistics, is derived from both the LCF and the Survey on Living Conditions, with harmonised income collection covering around 14,400 private households in the UK20. The effects of taxes and benefits analysis calculates its estimates up to final income from the LCF component, approximately 4,200 households21.
A two-week spending diary: what taking part involves
Taking part is a two-stage process. First, an interviewer visits the household and completes a household interview with each individual. Then each person keeps a record of their daily spending for two weeks, noting what they bought and what it cost2. It is the diary entries, added to the interview data, that build the national picture.
Households cannot volunteer: the sample is drawn at random from address lists, and participation, while requested, is voluntary2. The ONS removes certain records before producing results: households reporting negative expenditure, and households spending 80% or more of their total expenditure on a single class-level category, which removes around 0.5% of the total sample4.
The survey has also been changing. Questions on outstanding balances on loans and hire purchases, alongside questions requesting the annual percentage rate, were added from the first quarter of 2025, and the ONS expects to use these to derive household-level loan interest repayments with the 2027 weights update4. A further sample boost to 30,000 households from April 2026 has been planned, pending financial approvals7.
Northern Ireland has its own survey and £50 vouchers
Northern Ireland runs its own version of the survey. The Northern Ireland Living Costs and Food Survey has been running since 2008 and collects information on spending patterns there. Each year, a systematic random sample of 1,000 households is selected from the NISRA Address Register, which is primarily based on the Land and Property Services Pointer database, and data is collected using Computer Assisted Personal Interviewing19.
The information collected is used to update the contents of the consumer inflation (CPI) basket of goods and services, as well as providing information on food consumption and nutrition. The LCF is the main source of information on the cost of living in Northern Ireland, which is needed to calculate the rate of inflation19.
Taking part follows the same pattern as in Great Britain: each household member aged 16 and over is invited to take part, and each is asked to keep a record of their daily spending for two weeks. Children aged 7 to 15 are asked to keep a simplified version of the spending record19.
Unlike the GB survey, there is a stated incentive. Each person aged 16 and over who takes part receives a £50 Post Office voucher which can be exchanged for cash at any Post Office, and each child aged 7 to 15 receives a £10 Post Office voucher19. The related Family Resources Survey in Northern Ireland also includes a £10 Post Office voucher with its invitation letter22, and collects information on the incomes and circumstances of around 2,000 private households in Northern Ireland each year23.
Why the figures run about two years behind
Family Spending figures always describe the past. The ONS states plainly that the LCF data used in its statistics are at a lag of two years from the reference period and based on a calendar year: the 2023 index weights, for example, were based on the expenditure of LCF households surveyed between January 2021 and December 20214.
The lag is not unique to this survey. The Household total wealth in Great Britain statistics describe substantial delays between data collection and publication, such as the 34 month lag for Round 8, which reduce timeliness24. Survey processing, cleaning, weighting and quality assurance all take time, and the ONS publishes Family Spending annually rather than as a rolling monthly figure3.
The practical consequence for a reader is that the newest Family Spending figures describe a period roughly two years ago. When the FYE 2025 bulletin says spending remained £75.60 a week lower than FYE 20202, that comparison is itself being made about a year some time after the fact. For the most current picture of prices rather than spending, see latest UK inflation figures.
How household spending feeds into inflation and the CPI basket
The spending recorded in the survey does not just describe households; it helps decide how inflation is measured. The shares of spending by category become the weights in the consumer price indices, so a category households spend heavily on moves the headline inflation rate more than one they spend little on. The same survey results are used to update the contents of the CPI basket of goods and services, deciding which items are worth tracking at all19. How the basket works is covered in the inflation basket.
The coverage of the two measures differs, and this matters when comparing them. The CPIH and CPI cover the expenditure of all private households, institutional households and visitors to the UK18, whereas the LCF covers a sample of UK private households only.
A separate measure, the Household Costs Index (HCI), is designed to reflect inflation as households experience it, including some costs CPI leaves out. In the year to December 2025, overall UK household costs as measured by the HCI rose by 3.6%, while CPI rose by 3.4%25. Housing and household services contributed 0.43 percentage points more to the HCI annual rate than to CPI in December 202525. By June 2026 the gap between the HCI and CPI annual rates had narrowed to 0.2 percentage points26. Earlier, in June 2024, the housing and household services division contributed 1.38 percentage points more to the all-household HCI annual rate than to CPI27. The differences between the measures are set out in CPI and CPIH and CPIH or the Household Costs Index.
Limits of the figures: sample size, response rates and averages
The Family Spending figures are estimates from a sample, not a census, and the ONS is open about the constraints. The LCF sample of around 6,000 responding households a year4 is much smaller than the surveys behind some other official statistics: the Household Finances Survey covers around 11,300 private households for harmonised income collection in FYE 202428, and the Family Resources Survey covers around 20,000 households in the UK23. When the ONS moved housing affordability income estimates to the Household Finances Survey, it increased the sample size from 5,000 to 17,000 households29.
Response rates are a live concern across official household statistics. The wealth statistics note that declining response rates reduce representativeness, with differential non-response especially evident among renters and very high wealth households24. If certain kinds of household are less likely to take part, the averages shift accordingly.
Averages themselves have limits. A mean across all households mixes single people with large families and low earners with the richest fifth, whose spending of £1,083.60 a week1 sits far above the typical household. The ONS also removes extreme records, around 0.5% of the sample, before producing results4. Treat the figures as a benchmark for households like yours, using the published breakdowns, rather than a standard your own budget must meet.
Why different sources give different figures
Different official sources quote different average spending numbers because they measure different things. The ONS itself explains the distinction: Family Spending provides detailed information on household-level spending from the LCF, while it also produces an estimate of household final consumption expenditure, which covers expenditure by both UK-resident and foreign-resident households in the UK3. One is about households, the other about all spending in the UK economy.
Timing and adjustment matter too. A cash-terms figure such as £676.601 is not comparable with a real-terms comparison such as the £35.10 rise after inflation2, and the FYE 2024 bulletin's finding that spending remained £105.20 lower than in FYE 2020 in real terms7 describes a different year again. Other measures move on different schedules: Scottish Government analysis reports UK household expenditure growing at 3.8% on a four-quarter rolling average in one recent period30, a growth rate rather than a level.
Household finances beyond spending show the same variety. Estimates of the total value of excess saving accumulated by UK households since the start of the pandemic range from £143 billion to £338 billion, or 7.9% to 18.7% of household annual total resources31. A Scottish Government review notes British households have less consumer debt relative to their incomes than at any point since records began in 1999, while utility bills were the most commonly missed bills in the six months to January 2024, missed by 7.4% of all UK adults32. None of these contradict the spending figures; they answer different questions.
Finding figures for your region and nation
The place to start is the annual Family Spending report, which includes breakdowns by income group, household composition and region, in detailed tables of average weekly expenditure per household3. The report is published by the ONS each year and is free to read online.
For housing costs specifically, the ONS publishes affordability analysis by nation. The median house price to disposable household income affordability ratios were 7.9 in England, 5.4 in Wales, 5.3 in Scotland and 4.6 in Northern Ireland in FYE 202433. In England, average disposable household income was £37,000, and in Northern Ireland £36,000 for an average-priced home of £168,00033. Private rental affordability is published separately for England, Wales and Northern Ireland13.
For Northern Ireland, NISRA publishes its own survey results, including the Living Costs and Food Survey pages and the related Family Resources Survey quality report19, and the Consumer Council publishes a quarterly Northern Ireland Household Expenditure Tracker, with the Q2 2026 edition due in December 2026. Regional figures are also used in devolved government analysis, such as the Scottish Government's economic reports on household costs34.
Sources34 cited
- Family spending in the UK, April 2024 to March 2025 (PDF) Office for National Statistics, 2025
- Family spending in the UK, April 2024 to March 2025 Office for National Statistics, 2025
- Differences between ONS household expenditure statistics Office for National Statistics, 2026
- Calculating the Household Costs Indices Office for National Statistics, 2026
- Family spending in the UK, April 2019 to March 2020 (PDF) Office for National Statistics, 2021
- Family spending in the UK, April 2021 to March 2022 Office for National Statistics, 2022
- Family spending in the UK, April 2023 to March 2024 Office for National Statistics, 2024
- Scottish Economic Bulletin, December 2025 Scottish Government, 2025
- Research briefing CBP-9714: Energy prices House of Commons Library, 2026
- Budget 2025: summary of key announcements House of Lords Library, 2025
- Northern Ireland Poverty and Income Inequality Report 2022/23 NISRA, 2023
- Northern Ireland Poverty and Income Inequality Report 2021/22 NISRA, 2022
- Private rental affordability, England, Wales and Northern Ireland: 2024 (PDF) Office for National Statistics, 2025
- Private rental affordability, England: 2021 Office for National Statistics, 2021
- Private rental affordability, England: 2022 (PDF) Office for National Statistics, 2022
- Private rent and house prices, UK: June 2026 Office for National Statistics, 2026
- English Housing Survey 2024 to 2025 headline findings Department for Levelling Up, Housing and Communities
- Consumer price inflation, includes all 3 indices CPIH, CPI and RPI QMI Office for National Statistics, 2026
- Northern Ireland Living Costs and Food Survey NISRA, 2026
- Average household income, UK, financial year ending 2023 (PDF) Office for National Statistics, 2024
- Effects of taxes and benefits on UK household income, financial year ending 2024 (PDF) Office for National Statistics, 2025
- Family Resources Survey Northern Ireland quality and methodology report 2024/25 NISRA, 2026
- Family Resources Survey and Poverty and Income Inequality quality report 2024/25 NISRA, 2026
- Household total wealth in Great Britain: quality and methods guide (PDF) Office for National Statistics, 2026
- Household Costs Indices for UK household groups, October to December 2025 (PDF) Office for National Statistics, 2026
- Household Costs Indices for UK household groups, April to June 2026 Office for National Statistics, 2026
- Household Costs Indices for UK household groups, April to June 2024 (PDF) Office for National Statistics, 2024
- Household income inequality, UK, financial year ending 2024 Office for National Statistics, 2025
- Additional measures of housing affordability QMI Office for National Statistics, 2025
- Scottish Economic Insights, September 2025 Scottish Government, 2025
- Households' finances and saving, UK: 2020 to 2024 Office for National Statistics, 2024
- Review of emerging evidence on the effects of the cost of living crisis and debt in Scotland Scottish Government, 2024
- Housing purchase affordability, Great Britain: 2024 Office for National Statistics, 2025
- Scottish Economic Bulletin 2025 Scottish Government, 2025




 MoneyHelperFree, impartial money and pensions guidance, set up by government
 Citizens AdviceFree advice on money, consumer and legal problems in England and Wales
 GOV.UKOfficial information on tax, benefits and government services
 StepChangeFree debt advice and solutions from a charity
 FSCSProtects your money if a bank, insurer or investment firm fails