
Comparing money across time means comparing prices, and the UK has official price indices for exactly that purpose. The Office for National Statistics (ONS) publishes a measure of consumer prices every month, built from around 180,000 individual price quotations collected across the country1. An inflation calculator takes a sum from one year, looks up how much the general level of prices has moved since then, and scales the sum accordingly. The answer is an equivalent, not an exact match: it tells you what amount of money today would buy the same representative basket of goods and services as your original sum bought then.
The key numbers to know are the index values. The Consumer Prices Index (CPI) stood at 142.9 in July 2026 and 143.6 in August 2026, on a scale where 2015 equals 1002. Because both figures use the same base, dividing one by the other gives the change in prices between those months. The same method works over years or decades, though the further back you go, the more the choice of index matters, because the CPI only began in 1997 while the Retail Prices Index (RPI) provides estimates from 1947 onwards1.
What an inflation calculator tells you about past and future prices
An inflation calculator answers two different questions, and it is worth keeping them apart. The first is retrospective: what would £100 from 1990 be worth today? The second is forward-looking: what will £100 buy in ten years' time if prices keep rising? The first can be answered from recorded data. The second can only be estimated, because future inflation is not known in advance.
For the retrospective question, the method is arithmetic. Every month the ONS publishes an index level for each measure. In July 2026 the CPI stood at 142.9, and by August 2026 it had reached 143.62. Someone comparing a price from July 2026 with one from August 2026 would divide 143.6 by 142.9 and multiply their original sum by the result. Over longer periods the same calculation applies, using the index values for the two dates being compared. The result is the sum that would be needed today to match the original purchasing power, assuming the person's spending matched the average basket.
For the forward question, the calculator has to assume a future inflation rate, and the answer is only as good as that assumption. A useful discipline is to look at what has actually happened: UK consumer prices in 2026 are over 30% higher than at the start of 20216, a reminder of how quickly purchasing power can shift when inflation runs high. Some calculators serve narrower purposes too. The Financial Ombudsman Service has developed a calculator, made available for use from January 2026, to give financial businesses and consumers a rough illustration of the possible interest awards it may make on complaints7. That is a specialist tool for complaint outcomes, not a general price converter.
The limits of the method are worth stating plainly. An inflation calculator converts money using average prices. It cannot tell you what a specific item, a house, a pint, a season ticket, would have cost, because individual prices move differently from the average. For house prices there is a separate official measure, the UK House Price Index. For a sense of how the average household's spending has actually changed, the ONS family spending survey shows UK households had a real-terms increase of £35.10 (5%) in weekly expenditure in the financial year ending 2025 after accounting for inflation8.
A basket of around 760 goods and services
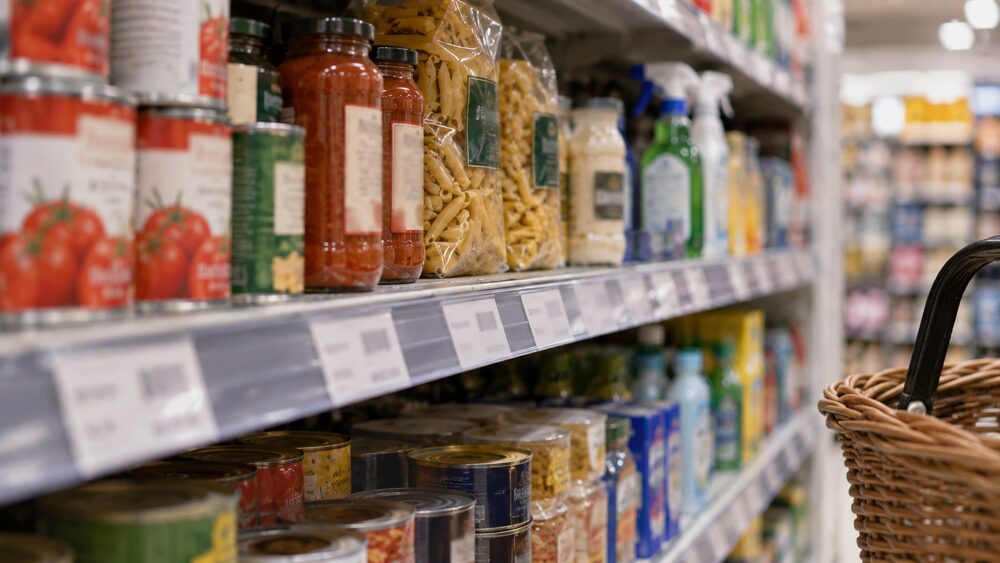
The whole system rests on the basket. The ONS compiles its consumer price indices from a representative sample of approximately 760 goods and services, reviewed annually, and their prices are collected from approximately 20,000 outlets within the UK1. The basket is deliberately ordinary: it contains the things a typical household buys, from food and clothing to transport and leisure, and it is refreshed each year so that it keeps up with how spending changes.
Collection happens in two ways. Local price collectors visit 20,000 shops in around 150 locations to collect over 100,000 prices, while around 160 items are collected centrally, meaning prices are gathered at a single point rather than by visiting shops1. The full dataset amounts to approximately 180,000 price quotations per month1. The coverage is the whole UK, and the frequency is monthly1.
Two design choices in the basket affect the numbers that come out of it. First, the weights: how much of each category the average household buys. The 2026 weights for CPIH and CPI were calculated using national accounts household final consumption expenditure data for 20242, so the basket reflects measured spending patterns, not guesses. Second, the averaging: stratum indices are calculated using predominantly the geometric mean for the CPIH and CPI, and arithmetic means for the RPI at the elementary aggregate level1. This is one reason the RPI tends to run higher than the CPI, a difference explored below. The dedicated page on the inflation basket covers how the contents are chosen and changed.
CPI, CPIH and RPI give different answers for the same years
Ask what a pound from 2010 is worth today and the answer depends on which index you use, and the differences are not trivial. The ONS describes the CPIH as its lead measure of inflation, based on economic principles2. The CPI was first published in 1997 as the Harmonised Index of Consumer Prices, a consistent measure allowing international comparison1. The RPI is older, providing estimates of inflation from 1947 onwards, with the first official release of consumer price inflation produced in January 19561.
The main structural difference is housing. The owner occupiers' housing costs component accounts for approximately 18% of the CPIH and is the main difference between it and the CPI2. The CPI excludes those costs altogether, which is one reason the two measures diverge when house-related costs move sharply. In August 2026 the CPIH rose by 3.3% over twelve months while the CPI rose by 3.1%3, and in July 2026 the largest contributing division to the CPI was housing and household services, contributing 0.59 percentage points to the rate2.
| Measure | What it covers | Housing treatment | Annual rate, August 2026 |
|---|---|---|---|
| CPIH | Lead ONS measure, based on economic principles | Includes owner occupiers' housing costs, about 18% of the index | 3.3%3 |
| CPI | All private households, institutional households and visitors to the UK | Excludes owner occupiers' housing costs | 3.1%3 |
| RPI | Longest series, from 1947 | Includes mortgage interest payments | Not a national statistic1 |
Coverage also differs. The CPIH and CPI cover the expenditure of all private households, institutional households and visitors to the UK1. The RPI's coverage is narrower, and its arithmetic averaging formula is one reason it has been judged a poor measure of inflation; the ONS calculates rates of change for the CPIH and CPI from unrounded index levels, while RPI rates of change are calculated from the rounded published indices1.
The scale of past differences shows why the choice matters. The CPIH annual inflation rate was 2.5% in 2021 and had increased to 7.9% by 20229, while the CPI rose by 2.6% in the twelve months to March 20258. There is also a measure built specifically to capture how households experience these differences, the Household Costs Indices, where housing contributed 0.83 percentage points more to the all-households rate than to the CPI in March 202510. The comparison pages on CPI and CPIH and CPI or RPI set out the practical differences in more detail.
Where the price data comes from
The traditional picture of price collectors with clipboards in shops is now only part of the story. Instead of collecting 25,000 prices per month directly from shops by price collectors, the ONS is now using approximately 300 million price points derived from sales of over a billion units of products per month11. This scanner data covers approximately 50% of the grocery market12. Large alternative data sources are also used for rail fares, second-hand cars and much of the grocery market, with the remainder of the grocery market still covered by other methods1.
The timing of collection is fixed and predictable. Much of the price collection takes place at a set point in time, usually the second or third Tuesday of each month1. The traditionally sourced data used in the July 2026 release were collected on or around 14 July 20262.
Not every measure uses the same sources. The Household Costs Indices, which show inflation for different types of household, draw on specific datasets: mortgage interest payments in the HCIs are calculated using the RPI model, which estimates interest due on a representative stock of mortgages for an average household13, and data on tuition fees paid by year are sourced from the Higher Education Statistics Agency13. One limitation the ONS is explicit about: household-specific price indices are not currently available because price data are collected from retailers rather than from households13. The index tracks what retailers charge, not what any one household actually pays.
The pandemic also left a mark on the data. Some series are based on less than half of the number of quotes used in February 2020, the most recent normal collection, because of reduced availability of products during the COVID-19 pandemic3. The ONS notes this in the detailed tables, and it is one reason very fine-grained comparisons across that period should be treated with care.
When the monthly inflation figure is published
Consumer price inflation is published monthly, and the schedule is reliable: publication takes place four or five weeks after collection and has never been delayed or missed1. The July 2026 bulletin was released on 19 August 20262. The next release after that was announced for 21 October 20263, and the ONS maintains a practice of giving advance notice of a minimum of 18 months to a maximum of 30 months for changes to its statistics1.
One feature of the system worth knowing is pre-release access. The Bank of England was granted exceptional pre-release access to an estimate of consumer price inflation data at 10:00am on Monday 14 September 2026, ahead of a Monetary Policy Committee meeting3. This is a controlled exception rather than a leak: access is logged and published.
The Household Costs Indices run on a different rhythm. Estimates are published every quarter but are presented as monthly data, with each publication including three consecutive months13. The HCIs are official statistics in development, and the release published on 28 May 2026 included new estimates for January to March 2026 using updated 2025 weights2. The page on latest UK inflation figures tracks the release calendar.
Why your own cost of living can feel higher
The headline rate is an average, and no household is average. The Household Costs Indices exist precisely because different groups face different inflation rates. In the year to June 2026, costs for low-income households (decile 2) and high-income households (decile 9) increased by 2.7% and 2.8% respectively14, a small gap in that period but not always so. In the year to March 2024 the low-income household rate was 3.9%15.
Tenure makes a bigger difference than income in some periods. Private renter households saw the highest rate in September 2025, at 4.5%16, and private renters' HCI inflation rate was higher than social and other renters in the year to June 2024, at 3.2%15. If your rent has been rising faster than average prices, the official CPI figure will understate what you have experienced, because the CPI does not include owner occupiers' housing costs at all.
Spending levels have also moved in real terms. UK households saw a real-terms increase of £15.40 (3%) in the financial year ending 2024 after accounting for inflation17, and £35.10 (5%) in the financial year ending 20258. Meanwhile, behaviour has changed: ONS survey data from September 2024 showed 49% of adults shopping around more due to the cost of living, the most common action people were taking18. The Household Costs Index page covers these differences in full.
The inflation target: 2% on the Consumer Prices Index
The Government sets the Bank of England a target of keeping inflation at 2%19, measured on the CPI. The Bank's statutory objective is monetary (price) and financial stability19. The target is symmetrical in spirit: the aim is for prices to rise slowly and steadily, neither accelerating away nor falling.
The UK has recently been above target. The CPI rose by 3.1% in the twelve months to August 2026, up from 2.9% the previous month3, and on a monthly basis CPI rose by 0.5% in August 2026, compared with a rise of 0.3% in August 20253. The CPIH rose by 3.3% over the same twelve months3. This followed a period when the target was met: from a peak in October 2022, CPI gradually reduced to reach the Bank of England's target rate of 2% by June 202420.
International comparison gives context. The UK's CPI inflation rate of 3.1% in August 2026 was higher than the first, or flash, estimates of inflation for France (2.7%) and Germany (2.9%)3. A month earlier the UK rate of 2.9% was higher than France's flash estimate (2.4%) and slightly above Germany's (2.8%)2. The pages on the inflation target and what inflation is explain the mechanics.
How Bank Rate is used to bring inflation down
The Bank of England's main tool for steering inflation is Bank Rate. Bank Rate is the rate of interest the Bank pays to commercial banks, building societies and financial institutions that hold money with it21. It is the core interest rate in the UK and it is the Bank's job to set it21. As of September 2026, it is 3.75%4.
The level has moved a great deal in recent years. In the years between 1975 and 2007, Bank Rate was 3.5% at its lowest point and 17% at its highest4. In December 2023 it stood at 5.25%22. The Bank reduced interest rates twice in 2024, in August and November, from 5.25% to 4.75%20, and in 2025 the Monetary Policy Committee lowered rates three times, from 4.75% to 4%23. Central banks usually change their rates by 0.25%, but the Bank can alter Bank Rate by as little or as much as it needs to19.
Higher rates work on inflation through the economy rather than on prices directly. The Bank has also used quantitative easing to stimulate the UK economy since the 2008 financial crisis19, and it has created rules to limit the riskiest type of mortgage lending and tests whether the largest banks can cope with big losses from unsecured debt19. The Monetary Policy Committee page explains who makes the decision and when.
Rate rises can take up to two years to work
The most important thing to understand about interest rate policy is its lag. The Bank of England states that it takes time for rate changes to work, usually up to two years5. A change in Bank Rate does not change prices next month; it works through borrowing costs, saving returns and spending decisions, and the effect builds gradually.
This lag has practical consequences for anyone trying to read the news. When the Bank raises rates, inflation may still rise for a while afterwards, because the previous conditions are still working through the system. Equally, when rates fall, relief in prices is not immediate. The pages on Bank Rate history and how Bank Rate affects mortgages trace the effects through.
What forecasts say about prices over the next year
Forecasts of future inflation are published regularly, and they shift. In September 2026, the Bank of England was projecting inflation to peak at 3.2% in the fourth quarter of 2026, with the Bank's next rate decision set for the 17th of September24. That projection is a central expectation, not a guarantee.
The recent record shows how much forecasts can move. In 2022 the Bank expected inflation to top 11% in October of that year, which would have been the highest in 40 years25. Looking further back, the CPIH annual rate was 2.5% in 2021 before jumping to 7.9% in 20229, a swing few forecasters fully anticipated. The cost of living crisis page covers that period in detail.
Some forward-looking figures are built into policy rather than prediction. Child benefit rates are uprated with CPI inflation in forecast years26, so the official forecast of CPI effectively sets those increases. Energy prices are set to rise from October 2026, which the Money and Pensions Service flagged as a reason to check whether a fixed tariff or a better deal elsewhere would suit a household27. Methodology also matters when reading forecasts: the most recent Household Costs Indices estimates were compiled using the weights for February to December 202412, so even current-looking figures rest on slightly older spending patterns.
Changes coming to the RPI and what they mean for index-linked figures
The RPI is being reformed. From 2030 at the earliest, CPIH methods and data sources will be introduced into the RPI, and the supplementary and lower-level indices of the RPI will be discontinued11. This follows a consultation process, and it means that long-run comparisons using the RPI will eventually rest on a different method across the break point. Anyone holding an index-linked product measured on RPI should expect its behaviour to change from that date.
Index-linked products differ in which index they follow, and the differences matter to returns. NS&I Index-linked Savings Certificates on extension terms earn index-linking only, linked to the RPI28, while certificates renewed after maturity have their index-linking calculated using the CPI instead of the RPI29. The Pension Protection Fund uprates payments in line with CPI, up to 2.5% a year for service accrued after 6 April 199730. The FCA's rules for the standardised cash warning accept the CPI as a measure of the current inflation rate, including a generic example of how inflation erosion would affect a £10,000 pot over five years assuming 0% interest31. Student loan Plan 5 interest is set as the lower of the RPI at the preceding March or 1% above the highest base rate of a nominated group of banks32. Historical measures have also shifted: up to 2013-14, the Households Below Average Income series used variants of the RPI to adjust incomes33. The RPI page covers where it is still used.
The Bank of England does not sell savings or chase refunds
Because the Bank of England sets rates and appears constantly in news about inflation, fraudsters use its name. The Bank states clearly what it will never do: it will never offer savings accounts, investments, cryptoassets or guaranteed returns, and it will never contact you about unclaimed estates, refunds, fines or warrants34. It will not ask you to move money for safety or to release funds, will not verify your identity by requesting National Insurance numbers or bank statements (unless you are exchanging banknotes with it), will not provide investment advice or endorsements, and will not contact you from personal email addresses34. The Bank of England and its staff do not endorse, promote or advertise financial products34.
The Bank is the UK's central bank and a publicly owned body35, not a high street institution competing for savers. Anyone contacted in its name about accounts, refunds or investments is being targeted by fraud, and the scams and fraud page explains where to report it.
Sources35 cited
- Consumer price inflation QMI: CPIH, CPI and RPI Office for National Statistics, 25 March 2026
- Consumer price inflation, UK: July 2026 Office for National Statistics, 19 August 2026
- Consumer price inflation, UK: August 2026 (PDF) Office for National Statistics, September 2026
- Current interest rate (Bank Rate) Bank of England, 17 September 2026
- How do higher interest rates help to lower inflation? Bank of England, 11 May 2023
- The cost of living: ongoing pressures and recent developments Senedd Research, 2026
- Guidance on our new interest awards from January 2026 Financial Ombudsman Service, January 2026
- Family spending in the UK: April 2024 to March 2025 Office for National Statistics, 2025
- Fuel poverty modelled estimates for Wales, October 2024 Welsh Government, October 2024
- Household Costs Indices for UK household groups: January to March 2025 Office for National Statistics, 2025
- Consumer price inflation, UK: August 2026 Office for National Statistics, September 2026
- Household Costs Indices for UK household groups: October to December 2025 Office for National Statistics, 26 February 2026
- Calculating the Household Costs Indices: methodology Office for National Statistics, 28 May 2026
- Household Costs Indices for UK household groups: April to June 2026 Office for National Statistics, 2026
- Household Costs Indices for UK household groups: January to March 2024 Office for National Statistics, 2024
- Scottish Economic Bulletin, December 2025 Scottish Government, December 2025
- Family spending in the UK: April 2023 to March 2024 Office for National Statistics, 2024
- Scottish Economic Bulletin, November 2024 Scottish Government, November 2024
- Inflation and interest rates: FAQ Bank of England, 4 February 2026
- Understanding the cost of living crisis in Scotland Scottish Government, February 2025
- What are interest rates? Bank of England, 30 July 2026
- Financial Stability Report, December 2023 Bank of England, 6 December 2023
- Scottish Economic Insights, September 2025 Scottish Government, September 2025
- Scottish Economic Insights, September 2026 Scottish Government, September 2026
- Work and Pensions Committee report summary UK Parliament, 2022
- Welfare spending: child benefit Office for Budget Responsibility, November 2023
- Five ways to save before Christmas Money and Pensions Service, 16 September 2026
- Index-linked Savings Certificates: extension terms NS&I, 18 May 2022
- Index-linked Savings Certificates: maturing investments NS&I, 15 May 2024
- Will my payments increase? Pension Protection Fund, 26 September 2026
- FCA Handbook COBS 19.20 Financial Conduct Authority, 26 June 2026
- How interest is calculated: Plan 5 GOV.UK, 2 July 2026
- Poverty in Northern Ireland: quality and methodology report NISRA, 27 March 2024
- Scams and fraud Bank of England, 18 June 2026
- What are stablecoins and how do they work? Bank of England, 1 April 2026





 MoneyHelperFree, impartial money and pensions guidance, set up by government
 Citizens AdviceFree advice on money, consumer and legal problems in England and Wales
 GOV.UKOfficial information on tax, benefits and government services
 StepChangeFree debt advice and solutions from a charity
 FSCSProtects your money if a bank, insurer or investment firm fails