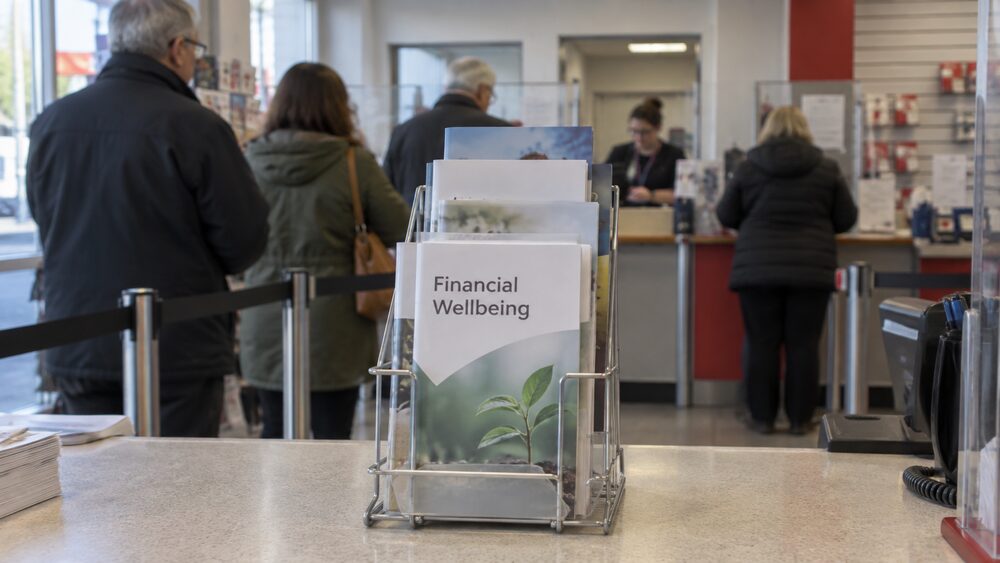
Financial wellbeing is a term used by government, regulators and support services to describe something simple: whether a person feels secure and in control of their money. The Money and Pensions Service (MaPS), the government body that co-ordinates money guidance in the UK, defines it as being about "feeling secure and in control", making the most of your money from day to day, dealing with the unexpected, and being on track for a healthy financial future1. It is not the same as being wealthy. Two households with the same income can have very different levels of financial wellbeing depending on their debts, their savings, their housing costs and how much worry their money causes them.
The idea has become a central one in UK policy. Since January 2020 there has been a UK Strategy for Financial Wellbeing, a ten-year framework with goals to be met by 2030, co-ordinated by MaPS and involving all four UK governments2. Alongside the strategy, official statistics measure how households are actually coping: how many are managing well, what they own, and how evenly wealth is spread. This page explains what financial wellbeing means, how it is measured, what the wealth figures say, and where free support is available if money worries are affecting your health or daily life.
What financial wellbeing means: feeling secure and in control
The most widely used definition in the UK comes from the Money and Pensions Service. For MaPS, financial wellbeing is about feeling secure and in control: making the most of your money from day to day, dealing with the unexpected, and being on track for a healthy financial future1. The same body describes it as covering five key areas of people's financial lives: receiving a meaningful financial education; saving regularly; using credit for everyday essentials; accessing debt advice; and planning for and in later life2. Those five areas are worth pausing on, because they show that financial wellbeing is defined as much by behaviour and knowledge as by income.
The definition is used well beyond MaPS. Public bodies across the UK adopt the same language when they describe the help they offer. Carmarthenshire County Council, for example, frames its debt and cost-of-living support as helping people of all ages to manage their money well and increase their financial wellbeing7. The term also overlaps with two phrases you may come across: financial resilience, which tends to emphasise the ability to absorb a shock such as a sudden bill or a drop in income, and financial wellness, which is used more often by employers and financial firms for workplace programmes and apps. All three point at the same underlying question: can you meet your obligations, cope with the unexpected, and feel that your money is under control?
In practice, that question has a day-to-day shape. It is whether the bills can be paid without borrowing, whether something breaking would create a crisis, and whether there is any sense of a plan for later life. The pages on making a budget, emergency funds and setting financial goals cover the practical building blocks, and free money guidance explains where to get help with them at no cost.
Money worries, mental health and work
Money and mental health are closely linked, and the support bodies that deal with one increasingly deal with both. The Financial Services Compensation Scheme (FSCS), the body that protects customers when financial firms fail, publishes a resource pointing people towards mental health support if they are struggling with money worries, including MoneyHelper, Mental Health & Money Advice and Mind6. That a deposit-protection body treats money worries as a mental health issue is a sign of how the two are now understood together.
The scale of the problem is visible in the regulator's own research. The Financial Conduct Authority's Financial Lives survey, its flagship study of how UK consumers experience financial services, covers consumers' experiences in depth, including their situation and vulnerability, and it does so across nearly 1,300 questions8. When the FCA researched consumer credit for its reform of the Consumer Credit Act, it ran focus groups deliberately split by financial stability: some participants were coping or comfortable, others just about coping, some struggling a little and some genuinely struggling9. The point of that structure is that financial stress is not a minority experience but a spectrum a large share of adults sit somewhere on.
Work and money pressures also feed into each other. In the Scottish Government's regular economic reporting, households described the ways they were mitigating the cost of living, with 44% shopping around more and 40% spending less on food shopping and essentials (April 2025)10. Coping strategies like these are common and rational, but sustained pressure on essentials is exactly the kind of strain that shows up in mental health, sleep and relationships. If money worries are affecting your health, the support listed at the end of this page is free and does not require a referral.
Measuring it: spending, saving, borrowing and planning
Because financial wellbeing is a feeling as well as a financial state, measuring it takes two things: survey questions about how households are managing, and hard data on what they own and owe. The independent measure that has gained the most traction is the Financial Wellbeing Tracker, produced by the University of Bristol's Personal Finance Research Centre. Its methodology draws on published academic work on financial wellbeing (Kempson, Finney and Poppe, 2017), and it segments households into four categories based on scores from a principal component analysis of seven survey questions covering the extent to which households could meet their financial obligations and the resources they had for dealing with an economic shock4.
Official surveys take a broader brush. The FCA's Financial Lives 2024 survey covers a wide range of topics across nearly 1,300 questions11. In Northern Ireland, the Survey of Living Conditions asks about many aspects of life including housing, health, employment, income and the cost of living12. The Office for National Statistics calculates the effects of taxes and benefits on household income using a Living Costs and Food component of around 4,200 households, which provides the income and expenditure data13. Each survey illuminates a different part of the same picture: what comes in, what goes out, and what is left over.
The measurement also matters to the rules that govern financial firms. The FCA's Consumer Duty sets out four outcomes, a suite of rules and guidance covering products and services, price and value, consumer understanding, and consumer support14. In plain terms, firms are expected to sell products that people can understand and afford, and the Duty exists because the regulator's evidence, including surveys like Financial Lives, shows how often that does not happen. Government support programmes are measured too: an evaluation of Cost of Living Payments in Scotland found over 60% of recipients reporting positive impacts on essential costs, particularly energy bills and food15.
From struggling to thriving: the four score bands
The Financial Wellbeing Tracker turns its seven questions into a score out of 100 and sorts households into four bands. Those with a score of less than 30 out of 100 are deemed to be in serious financial difficulties. Scores of 30 to 49 are taken as indicative of struggling to make ends meet. Scores of 50 to 79 indicate a household that is potentially exposed financially, and those scoring 80 to 100 are classed as financially secure4.
The bands are useful because they separate two situations that are often blurred together. A household that is exposed (50 to 79) is managing now but has little protection against a shock: it is one broken boiler or one lost shift away from struggling. A household that is struggling (30 to 49) is already finding it hard to make ends meet, which is a different problem requiring different help, often debt advice rather than budgeting tips. And a household in serious financial difficulties, scoring below 30, is likely to need structured support of the kind described in the last section of this page.
The bands also show why average figures can mislead. A country where most households score as financially secure but a substantial minority score below 30 is doing very differently from one where everyone clusters in the middle, even if the averages match. That is why the official statistics quoted later in this page report medians and the spread between the wealthiest and least wealthy, not just the headline. If you want to work out where your own finances sit, the pages on the order to sort out your finances and what to do with money left over each month are a practical starting point.
The UK Strategy for Financial Wellbeing: a ten-year plan
The UK Strategy for Financial Wellbeing is the ten-year framework which aims to achieve the vision of everyone making the most of their money throughout their lives5. It was launched in January 2020, after 12 months of listening to stakeholders and developing the strategy, and MaPS has since worked with partners from all four governments in the UK, industry and the third sector2. The strategy sets goals for 2030 and brings together organisations from a diverse range of sectors1.
MaPS co-ordinates the strategy, working with partners and stakeholders to help people across the UK16. The work is ongoing and practical rather than purely high-level. In 2026 MaPS launched a toolkit aiming to strengthen collaboration between creditors and debt advisers, so that people in problem debt get more joined-up treatment from the firms they owe money to and the advisers helping them16. The same year, MaPS published research from MoneyView, its annual and nationally representative survey, finding that two in five people over 55 have no retirement plan, and launched a guidance tool in response17.
For an individual reader, the strategy matters less as a policy document than as a signal of what free help exists. The bodies the strategy pulls together, including MaPS's own MoneyHelper service, are the same ones listed under support below. The strategy's five priority areas, from financial education to later-life planning, map onto the practical guides on this site: how to start saving each month, how much to pay into a pension and teaching children about money.
What UK households hold: median wealth of £293,700
The main source for what UK households own is the Wealth and Assets Survey (WAS), run by the Office for National Statistics. Its most recent published round, Round 8, covers April 2020 to March 2022 and is based on an achieved sample of 15,100 households in Great Britain. Median household wealth in Great Britain was £293,7003. The median is the halfway point: half of households have more, half have less. It is used rather than the average because wealth is highly skewed, and a small number of very wealthy households would drag an average far above what a typical household actually holds.
The published figures on some points disagree, and it is worth being clear about that. Alongside the £293,700 median, another release from the same survey puts median household wealth at £489,800 for the same period3. On financial wealth, one release reports a median of £10,400 for April 2020 to March 2022, up 25% in real terms from £8,300 in April 2018 to March 2020, while another gives £1,3003. Where the figures conflict, both are given here rather than one being quietly preferred.
Older rounds give a sense of the trend. Written evidence to Parliament in 2018 cited median household savings in Great Britain, including property, pensions and financial assets, of £233,000, with the bottom half of households holding just 9%18. In the July 2014 to June 2016 round, the median household total wealth excluding private pension wealth was £156,300, the top 10% of households had total wealth of £1,224,900 or more, and the top 1% had £3,243,400 or more19. Mean total wealth in April 2016 to March 2018 was £564,300, up from £508,000 two years earlier, and in the lowest wealth decile, average net financial wealth was negative £3,900, with 51% of those households having debts that exceeded their assets20. Households where the head was unemployed or economically inactive had average total wealth of around £25,000, with most having no property or private pensions21.
Property and pensions make up most household wealth
Total wealth in the official statistics is the sum of four components: net financial wealth, pension wealth, physical wealth and net property wealth at the household level22. In the latest round, net property wealth made up the largest proportion of household wealth in Great Britain at 40%, followed by private pension wealth at 35%, with net financial wealth (14%) and physical wealth (10%) making up much smaller proportions3. Another release from the same survey puts the private pension share at 28%, so the two figures should be treated as an unresolved difference between publications3.
The dominance of property and pensions has practical consequences. It means the median wealth figure of £293,700 is not money that can be spent: most of it is the value of a home and a pension pot. It also means wealth varies enormously with tenure and age. Only a very small proportion of renters (5%) have any property wealth, and there is a higher proportion of renters in London (over 50%) than in other regions, for example England at 38%3. Households that owned their property outright, and households with a head aged 65 to 74, saw the largest increases in median financial wealth, up £4,300 (8%) in real terms between rounds3.
Pension wealth itself is unevenly held. In the July 2012 to June 2014 round, 28% of households in Great Britain had wealth in current occupational defined benefit pensions, with a median of £85,500, and a similar proportion (30%) had pensions already in payment, with median wealth of £146,90023. Median private pension wealth for households with such wealth was lower in England (£95,700) than in Wales23. Earlier analysis showed private pension wealth and net property wealth together accounted for over three quarters of aggregate total wealth, with financial wealth at 14% and physical wealth at 10%, and more than three quarters of physical wealth (78%) made up of household goods and contents24. For most people, the practical questions are covered in the guides to pensions and buying a home.
Where the wealth figures fall short
The wealth statistics are powerful, but they have known limits, and the ONS is open about them. Certain forms of wealth cannot yet be captured by the survey: some informal debts, offshore assets and complex trust structures25. Because wealth data are highly skewed, the statistics use medians rather than means to reflect central tendency, except for physical wealth where means are used25. Declining response rates reduce representativeness and the reliability of longitudinal analysis, with differential non-response especially evident among renters and very high wealth households25.
Two further limits matter for interpretation. First, the survey measures private pension wealth and does not include the value of State Pension entitlements, and it does not capture all current pension pots in the UK26. Since the State Pension is the foundation of most people's retirement income, the figures understate total retirement resources. Second, the accreditation of the Wealth and Assets Survey, the official quality mark for national statistics, has been suspended from Round 8, covering the period 2020 to 2022 onwards, while response rates are addressed; Round 8 was also collected entirely by telephone because of the coronavirus pandemic, which changed how households were reached3.
The figures also hide wide differences beneath the median. The wealthiest 10% of households had wealth of £1,200,500 or more, while the least wealthy 10% had £16,500 or less3. The wealthiest 1% of households held 10% of all household wealth, the same proportion as held by the least wealthy 50% of households combined3. The Gini coefficient, a standard measure of inequality, was 0.59 for household wealth, far higher than the 0.59 figure's counterpart of 0.36 for disposable income3. In the July 2012 to June 2014 round, median net financial wealth for households in the least wealthy 50% was £40024. Regional differences are large too: property wealth ranged from 30% of household wealth in the North East to much higher shares elsewhere3.
How households say they are managing tells a similar story. In Scotland, 54% of households in 2024 reported they were managing well financially, up from 52% in 2023 and 42% in 199927. But households relying mainly on benefits, including the State Pension, were the most likely to say they were not managing well, at 15% in 202428, 16% in 202327 and 17% in 202229. Optimism about the future remained considerably lower, at 19% in December 2024, among households saying they are managing less well30. The contrast with better-off areas is stark: only 3% of households in the 20% least deprived areas of Scotland reported not managing well financially in 202331.
Where to get support with money worries
If money worries are affecting your health or daily life, free support exists and does not require a referral. The FSCS lists resources for mental health support for people struggling with money worries, including MoneyHelper (the government-backed guidance service run by MaPS), Mental Health & Money Advice (a service specifically for people with both mental health and money problems) and Mind (the mental health charity)6. The pages on free money guidance, help in Scotland, help in Wales and help in Northern Ireland set out what each offers and how to reach them.
Evidence from government evaluations suggests these services make a measurable difference. An evaluation of the Help to Save scheme, a government savings scheme for people on low incomes, found that two thirds (66%) of users self-reported that Help to Save had improved their financial circumstances32. Household income statistics that inform support policy come from the Family Resources Survey, run by the Department for Work and Pensions to inform the development, monitoring and evaluation of social welfare policy33, and the Household Finances Survey, run by the Office for National Statistics34. The Wealth and Assets Survey's own primary users include HM Revenue and Customs, the Scottish Government, the Department for Work and Pensions, HM Treasury and the Welsh Government22, which is one reason the data it produces shapes who gets help.
Support is also there for the situations that surround money worries rather than the money itself: free help if someone pressures you over money, borrowing from or lending to family and friends, and the full range of options in the guide to debt. None of these services charges, and none requires you to have missed a payment or reached a crisis point first.
Sources34 cited
- What is financial wellbeing Money and Pensions Service, 2026-09-26
- What is financial wellbeing: UK Strategy for Financial Wellbeing Money and Pensions Service, 2026-09-27
- Total wealth in Great Britain: April 2020 to March 2022 Office for National Statistics, 2025-01-24
- Financial Wellbeing Tracker University of Bristol Personal Finance Research Centre, 2026-02
- UK Strategy for Financial Wellbeing Money and Pensions Service, 2026-09-27
- Cost of living crisis: mental health support Financial Services Compensation Scheme, 2026-09-25
- Advice and support on debt Carmarthenshire County Council, 2026-08-04
- Financial Lives 2024: consumers' experiences of financial services Financial Conduct Authority, 2024
- Consumer Credit Act reform: consumer research insight report Financial Conduct Authority, 2025-10
- Scottish Economic Bulletin 2025 Scottish Government, 2025-05-23
- Financial Lives Survey 2024: key findings Financial Conduct Authority, 2025-05-16
- Survey of Living Conditions Northern Ireland Statistics and Research Agency, 2026
- Effects of taxes and benefits on UK household income, financial year ending 2024 Office for National Statistics, 2025-09-25
- Consumer Duty: about Financial Conduct Authority, 2026-02-24
- Child poverty in UK Scotland Scottish Government, 2026-08-06
- New MaPS toolkit aims to strengthen collaboration between creditors and debt advisers Money and Pensions Service, 2026-09-14
- Two in five over 55s have no retirement plan as MaPS launches new Get Retirement guidance tool Money and Pensions Service, 2026
- Written evidence to Parliament on household wealth UK Parliament, 2018-01
- Wealth in Great Britain Wave 5: 2014 to 2016 Office for National Statistics, 2014
- Total wealth in Great Britain: April 2016 to March 2018 Office for National Statistics, 2016
- Total wealth in Great Britain: April 2018 to March 2020 Office for National Statistics, 2018
- Household total wealth in Great Britain: quality and methods guide Office for National Statistics, 2026-03-27
- Private pension wealth: Wealth in Great Britain 2012 to 2014 Office for National Statistics, 2012
- Main results from the Wealth and Assets Survey July 2012 to June 2014 Office for National Statistics, 2012
- Household total wealth in Great Britain: quality and methods guide (updated) Office for National Statistics, 2026-07-07
- Pension pots in the UK by sex and age: FOI response Office for National Statistics, 2026-04-23
- Financial information from the Scottish Household Survey Scottish Government, 2024-12-02
- Financial information from the Scottish Household Survey 2024 Scottish Government, 2024
- Scottish Household Survey 2022: key findings Scottish Government, 2022
- Understanding the cost of living crisis in Scotland Scottish Government, 2024
- Scotland's People annual report: Scottish Household Survey 2017 Scottish Government, 2017
- Evaluation of Help to Save: quantitative results HM Government, 2025-11-03
- Family Resources Survey financial year 2024 to 2025 Department for Work and Pensions, 2026-03-26
- Average household income UK, financial year ending 2023 Office for National Statistics, 2024-09-24




 MoneyHelperFree, impartial money and pensions guidance, set up by government
 Citizens AdviceFree advice on money, consumer and legal problems in England and Wales
 StepChangeFree debt advice and solutions from a charity
 Turn2usFree benefits calculator and grants search from a charity
 GOV.UKOfficial information on tax, benefits and government services