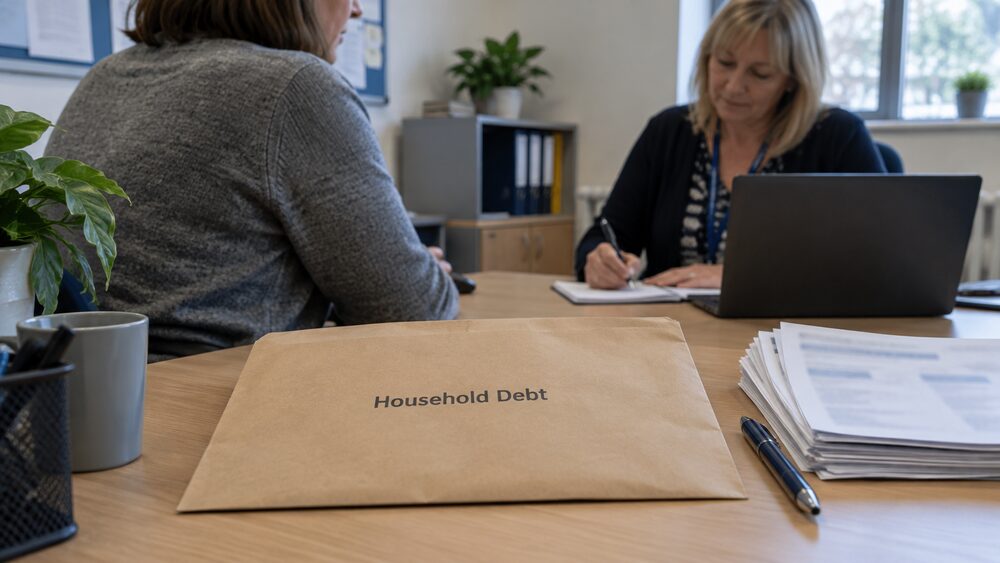
UK households owed just under £2 trillion in total debt in the first quarter of 2022, excluding student loans1. The vast majority of that, more than seven pounds in every ten borrowed, is mortgage debt rather than credit cards, overdrafts or personal loans2. Measured against income, household debt has been falling: the debt-to-income ratio stood at 117.2% in the first quarter of 2026, down from a peak of around 150% before the global financial crisis3.
These figures come from official statistics published by the Bank of England, the Office for National Statistics (ONS) and UK Finance, and they are the numbers quoted in Parliament, in the financial press and in the Bank of England's own assessments of the economy. This page sets out what each measure covers, what the latest figures show, and where the numbers stop, so you can tell the difference between a household with a large mortgage and a household in genuine difficulty.
Total household debt: just under £2 trillion
The headline figure for what UK households owe is just under £2 trillion, which was the total stock of household debt excluding student loans in the first quarter of 20221. Two things matter when reading that number. First, it excludes student loans, which are counted separately in the national accounts. Second, it is a stock, not a flow: it is everything outstanding at a point in time, not what households borrow in a year.
The figure has grown over the long term, but far more slowly than it once did. Average annual household debt growth slowed from around 9% a year before the global financial crisis to around 2.4% a year over the decade to 20221. Earlier survey-based measures show the same picture in cash terms: total aggregate debt of all households in Great Britain was £1.22 trillion in the period July 2014 to June 2016, an 8% increase on the previous survey period, of which £1.11 trillion was mortgage debt and £107.3 billion was financial debt such as credit cards, loans and overdrafts8. A 2010 statutory instrument quoted total UK consumer lending of £1.46 trillion, of which £1.24 trillion was accounted for by mortgages9.
The differences between these figures come from what each measure covers and when it was taken. The £2 trillion figure covers the whole UK and excludes student loans; the £1.22 trillion figure covers Great Britain and comes from a household survey; the £1.46 trillion figure predates both. When comparing numbers across years or sources, check the coverage, the date and whether student loans are in or out.
Debt compared with income: 117.2% and falling
A big debt number means little on its own. What matters to the economy, and to whether debt is sustainable, is debt compared with income. The most watched measure is the household debt-to-income ratio: total household debt as a percentage of total annual disposable income.
On that measure, UK households are less stretched than they have been for most of the past two decades. In the first quarter of 2026 the debt-to-income ratio was 117.2%, and household debt levels have been falling since the beginning of 20223. The Bank of England put the ratio at 118% in the first quarter of 2023, materially lower than the peak of around 150% reached before the global financial crisis4. An earlier Bank speech, using figures excluding student loans, put the ratio at around 124.5% of total household income in the first quarter of 2022, against a 2008 peak of 146%1. In 2014, total household debt was just under one and a half times household disposable income10.
One technical point explains why older figures sometimes look different: the household debt and income source data were changed in May 2019. Previously the totals included the non-profit sector, mostly charities and universities; the revised data reflects only individuals in the household sector3. Figures published before and after that change are not directly comparable.
The direction of travel also shows up in consumer borrowing alone. A Scottish Government review noted that British households have "less consumer debt relative to their incomes than at any point since records began in 1999"11. So while the cash total owed is large, the burden relative to income is lower than at almost any time in the past quarter century.
Mortgages make up most of what households owe
Mortgages are the largest debt for households in the UK2, and the Bank of England describes them as the greatest source of household debt12. When the Bank looks at how much money British households borrow, more than seven out of ten pounds are for mortgages2. That is why the household debt figures move mainly with the housing market, and why a page about total household debt is mostly a page about mortgages.
Around 7.1 million households in England, about 30% of all households, own their home with a mortgage13. Earlier survey data found 32% of UK households held mortgages in 201314. Most of those borrowers are not stretched to the limit: around 3.5% of households reported an outstanding mortgage debt of more than four times their current pre-tax income, according to Bank of England analysis of survey data covering July 2012 to June 201615.
Unsecured borrowing is more widespread but much smaller in amount. Analysis of survey data from 2008 to 2009 found that 64% of households had at least one unsecured credit commitment, with 11% holding four or more9. So while most households carry some form of non-mortgage debt, the amounts are typically modest compared with a home loan, and it is mortgage debt that dominates the national totals.
Consumer credit: credit cards, overdrafts and loans
Consumer credit is everything households borrow other than mortgages: credit cards, overdrafts, car finance, personal loans and similar products. The Bank of England publishes consumer credit data with breakdowns by type of lender and product, including credit card lending, overdrafts and other loans16.
The last time consumer credit grew at a pace that worried the regulator, the Financial Conduct Authority (FCA) reported that UK consumers owed £188.7 billion of consumer credit lending as at September 2016, a 10.3% increase on the previous 12 months7. That rapid growth prompted an FCA thematic review of the credit card market. Growth since then has been far slower, and as noted above, consumer debt relative to income is at its lowest since records began in 199911.
Household surveys fill in the picture of who owes what. In October 2023, most UK households, 65%, held consumer credit debt, and a quarter, 25%, owed at least £5,000 across all of their consumer credit commitments. A third of households, 35%, were making repayments on at least one credit card in the previous six months5. The ONS publishes the share of households with an outstanding credit card balance for Great Britain covering July 2006 to June 201617, and a further breakdown of households with credit card debt by income decile, which shows card debt is held across the income distribution, not only by the lowest earners18.
The Bank of England's Credit Conditions Survey for 2026 Q2 shows lenders reporting rising demand for credit card lending from households (a net percentage balance of 14.7), increased availability of unsecured credit (15.4), and higher default rates on both credit card loans (10.5) and total unsecured loans (16.1) over the previous three months19. Those balances measure direction of change as reported by lenders, not amounts owed.
How interest rates feed into what households pay
Interest rates decide what debt costs, and the past few years have shown how unevenly rate changes land. The ONS Household Costs Indices (HCIs) measure inflation as different groups of households actually experience it, and mortgage interest is one of the biggest reasons those experiences diverge. The Household Costs Index page explains the measure in full.
In the year to December 2025, mortgage interest payments contributed 0.17 percentage points to the annual HCI inflation rate for all households, down from 0.21 percentage points. For mortgagor households, the contribution was much larger, at 0.54 percentage points, down from 0.6420. In the year to June 2026, mortgage interest payments contributed 0.14 percentage points more to inflation for non-retired households than for retired households21. And in the year to March 2024, households with children faced contributions from mortgage interest payments 0.66 percentage points higher than households without children22.
The mechanism is simple: the Bank of England changes Bank Rate to keep inflation at the 2% target the Government sets it23, and those changes feed through to the rates households pay on variable borrowing and on new fixed deals. The pages on Bank Rate and your mortgage and typical borrowing costs cover the detail. The essential point for the debt statistics is that higher rates do not change how much is owed, but they change how much of a household's income the debt eats up.
Mortgage payments when fixed deals end
Most UK mortgages are on fixed rates, so rate changes reach borrowers only when a deal ends and they move to a new one. Nearly three-quarters, 72%, of outstanding buy-to-let mortgages in the UK were on fixed interest rates as of June 202224, and the owner-occupier market is more heavily fixed still. The government recognises that families are worried about the impact of rising mortgage rates, particularly those coming to the end of a fixed rate deal25.
The scale of the jump depends on the balance and the gap between old and new rates. Independent guidance from Which? illustrates the arithmetic: on a £250,000 mortgage over a 20-year term at 4.5%, a 0.25 percentage point rise in the rate adds £33.94 to the monthly payment, and a 0.5 percentage point rise adds £68.27 a month, or £819.24 a year. On a £100,000 mortgage over the same term and rate, a 0.5 percentage point rise adds £27.31 a month, or £327.72 a year26.
Survey evidence shows what this has meant in practice. Among mortgagors who had remortgaged in the previous six months when their fixed term came to an end, the median monthly mortgage payment was £780 as of October 20235. The Bank of England projected in July 2023 that the share of income going to mortgage interest payments would rise from 6.2% to around 8% by mid-2026, while noting this would remain below the peaks seen in both the 2007 to 2008 global financial crisis and the early 1990s recession4.
During the cost of living period, lenders offered payment deferrals under an FCA project on borrowers in financial difficulty, resulting in 1.8 million mortgages and 3.4 to 4 million consumer credit agreements having their payments deferred27. The government's mortgage charter states that the UK mortgage market remains resilient, open and competitive across all major product types and segments, and that significant protections remain in place for anyone worried about their mortgage payments25.
Longer mortgage terms and borrowing into later life
One way households have managed bigger loans is by stretching them over more years. A Financial Ombudsman Service insight briefing found that 38% of first-time buyers in England in 2013/14 took mortgages with a term of 30 years or more28. Longer terms cut the monthly payment but raise the total interest paid over the life of the loan, and they mean debt extending further into later life. The ONS publishes a breakdown of mortgage debt, unsecured debt and interest-only mortgages by the age band of the household reference person for Great Britain, covering July 2012 to June 201629, and a breakdown of household mortgage debt by region over the period July 2006 to June 201630.
How much people borrow relative to income has edged up. ONS mortgage statistics covering the UK between 2006 and 2025 show the average mortgage loan-to-income ratio increased to 3.5 in 2025, from 3.3 in 2024, for mortgage sales overall31. These are official statistics in development, a status the ONS applies to newer statistics still being evaluated, so the figures may be revised31.
The Bank of England does not decide who gets a mortgage, but it has created rules to limit the riskiest type of mortgage lending, and it tests whether the largest banks can cope with big losses from unsecured debt32. Those limits act as a brake on how far lending standards can loosen, which is one reason the debt-to-income ratio has stayed well below its pre-crisis peak.
Households behind on payments and in arrears
Debt totals say nothing about whether people can keep up. The arrears figures are where the statistics meet real difficulty.
For regulated mortgages, the share of outstanding balances in arrears of more than 1.5% of the loan balance stood at 1.1% in the second quarter of 2025, having edged down from a recent peak of 1.2%, but remaining significantly above the post-pandemic low of 0.7% in the third quarter of 20226. In the non-regulated residential market, mortgages 1.5% or more in arrears represented 1.5% of total non-regulated residential loans at the end of Q2 20256. Buy-to-let arrears have followed a similar path: UK Finance data showed 5,860 buy-to-let mortgages in arrears of 2.5% or more of the outstanding balance in the first quarter of 202233, and buy-to-let mortgages in arrears later peaked at 19,570 in the fourth quarter of 2023 before falling6.
The arrears rate rose from its 2022 low, peaked, and has since edged down.
Household-level surveys show the wider picture beyond mortgages. The number of households in serious financial difficulty rose from 2.8 million, or 10% of all households, to 4.8 million, or 17%, by October 20235. Among households in serious difficulty, 85% had outstanding credit, compared with around four in ten households overall, and nearly half, 46%, reported owing more than £5,0005.
What happens when mortgage payments are missed
Falling behind on a mortgage triggers a process, not an immediate loss of the home. Lenders must follow FCA rules on treating customers in financial difficulty, which require them to consider the customer's circumstances and options such as arranging a payment plan or changing the mortgage terms before any enforcement action. Repossession is the last resort, and the mortgage charter confirms significant protections remain in place for anyone worried about their mortgage payments25.
Guidance differs slightly between the nations. In Northern Ireland, nidirect guidance on when a lender takes action against you sets out the court process and states that where arrears arose because of illness or a medical condition which may prevent someone from working or making payments for a period of time, a letter from a GP, consultant or medical social worker explaining the condition or health conditions is also brought to the process34.
If you are behind on any debt, the debt section of this site sets out the free help available, the options such as repayment plans and formal solutions, and your rights with creditors.
Energy debt and other bills people fall behind on
Not all debt is borrowing from a bank. A large and growing part of household debt is money owed to utility companies, government, landlords and housing associations. The National Audit Office estimated this at £18 billion in 2018, a minimum figure based on available data and research35. Earlier NAO work found that some 11% of the UK population reported difficulty keeping up with their bills and credit commitments as far back as 200836.
Energy debt is the most common form. Among Citizens Advice clients in England and Wales in 2024, energy debts were the most common debt issue, affecting 50% of clients11. Arrears fall hardest on larger families: for households with three or more children, arrears rates were three times the average, at 18% for electricity and 17% for gas or other energy bills as of October 20235.
Being refused credit compounds the problem. Among low income households denied credit in the previous 12 months, 85% were currently in arrears with at least one household bill11. Yet help is underused: only 21% of adults who felt heavily burdened by their debts, and 29% of adults who had fallen behind on or missed paying their bills, sought help in the last year, according to FCA analysis37. The energy price cap page explains how Ofgem limits unit rates, and the debt page covers where to get free, impartial advice.
Where the figures come from and help if you are struggling
The household debt statistics come from several official sources, and knowing which is which helps you read them correctly:
- Bank of England: total consumer credit and mortgage lending outstanding, the Credit Conditions Survey of lenders, and the debt-to-income ratio used in its Financial Stability Reports4.
- ONS Wealth and Assets Survey: household-level debt, wealth and financial difficulty, reported through datasets such as household debt in Great Britain38, and ad hoc breakdowns by debt type, income decile, age band and region17.
- ONS quarterly sector accounts: the household sector's borrowing and saving position each quarter.
- UK Finance and the Scottish Government's housing market reviews: mortgage arrears and possessions figures6.
One point of caution that applies to any figure on this page: the Bank of England will never contact you about your debts. It states it will never contact you about unclaimed estates, refunds, fines or warrants, never ask you to move money "for safety" or to "release funds", never verify your identity by requesting National Insurance numbers or bank statements, never offer savings accounts, investments, cryptoassets or "guaranteed returns", never provide investment advice or endorsements, and never contact you from personal email addresses39. Any message claiming otherwise is a scam; the scams and fraud page covers what to do.
If the figures on this page describe your own situation rather than an abstract economy, free help exists. The debt section explains the options, from informal arrangements to formal solutions, and your rights while you seek advice. Charities and services such as those listed there provide free, impartial debt advice, and the FCA's own evidence shows most people who fall behind never ask for it37.
Sources39 cited
- Colette Bowe speech at the 2nd Research Workshop Bank of England, September 2022
- What's the Bank of England's role in the housing market? Bank of England, 2019
- Household debt statistics, SN02885 House of Commons Library, 2026
- Financial Stability Report, July 2023 Bank of England, July 2023
- Financial Fairness Tracker Wave 9 University of Bristol Personal Finance Research Centre, 2023
- Scottish Housing Market Review Q3 2025, page 9 Scottish Government, 2025
- Credit card market study interim report, TR16/10 Financial Conduct Authority, 2016
- Wealth in Great Britain Wave 5 Office for National Statistics
- The Financial Services and Markets Act 2000 (Conduct of Business) (Credit Card) Order 2010 explanatory memorandum legislation.gov.uk, 2010
- Interest rates and inflation, Key Issues 2015 UK Parliament, 2015
- Review of emerging evidence on the effects of the cost of living crisis on debt in Scotland, page 5 Scottish Government, 2024
- How does the housing market affect the economy? Bank of England, 2020
- Housing and home ownership in the UK, SN04769 House of Commons Library
- Family Spending 2014, Chapter 2: Housing expenditure Office for National Statistics, 2014
- The financial position of British households, 2019 Q4 Quarterly Bulletin Bank of England, 2019
- Consumer credit statistics Bank of England, 2023
- Households with an outstanding credit card balance, Great Britain Office for National Statistics, 2018
- Households with credit card debt by income deciles Office for National Statistics, 2017
- Credit Conditions Survey, 2026 Q2 Bank of England, 2026
- Household Costs Indices for UK household groups, October to December 2025 Office for National Statistics, 2026
- Household Costs Indices for UK household groups, April to June 2026 Office for National Statistics, 2026
- Household Costs Indices for UK household groups, January to March 2024 Office for National Statistics, 2024
- Inflation and interest rates FAQ Bank of England, 2026
- Cost of living bill key statistics Scottish Government
- Mortgage Charter 2026 HM Government, 2026
- Bank of England base rate and your mortgage Which?, 2026
- Borrowers in financial difficulty project Financial Conduct Authority, 2022
- Age insight briefing 2015 Financial Ombudsman Service, 2015
- Breakdown of mortgage debt, unsecured debt and interest only mortgages by HRP age band Office for National Statistics, 2018
- Breakdown of household mortgage debt by region, Great Britain Office for National Statistics, 2019
- Mortgage statistics, UK: 2025 Office for National Statistics, 2026
- What do I need to know about debt? Bank of England, 2025
- Scottish Housing Market Review Q2 2022, page 8 Scottish Government, 2022
- When a lender takes action against you nidirect, 2025
- Tackling problem debt, summary National Audit Office, 2018
- NAO report on household debt National Audit Office, 2010
- Review of emerging evidence on the effects of the cost of living crisis on debt in Scotland, page 7 Scottish Government
- Household debt: wealth in Great Britain dataset Office for National Statistics, 2025
- Scams and fraud Bank of England, 2026





 MoneyHelperFree, impartial money and pensions guidance, set up by government
 Citizens AdviceFree advice on money, consumer and legal problems in England and Wales
 GOV.UKOfficial information on tax, benefits and government services
 StepChangeFree debt advice and solutions from a charity
 FSCSProtects your money if a bank, insurer or investment firm fails