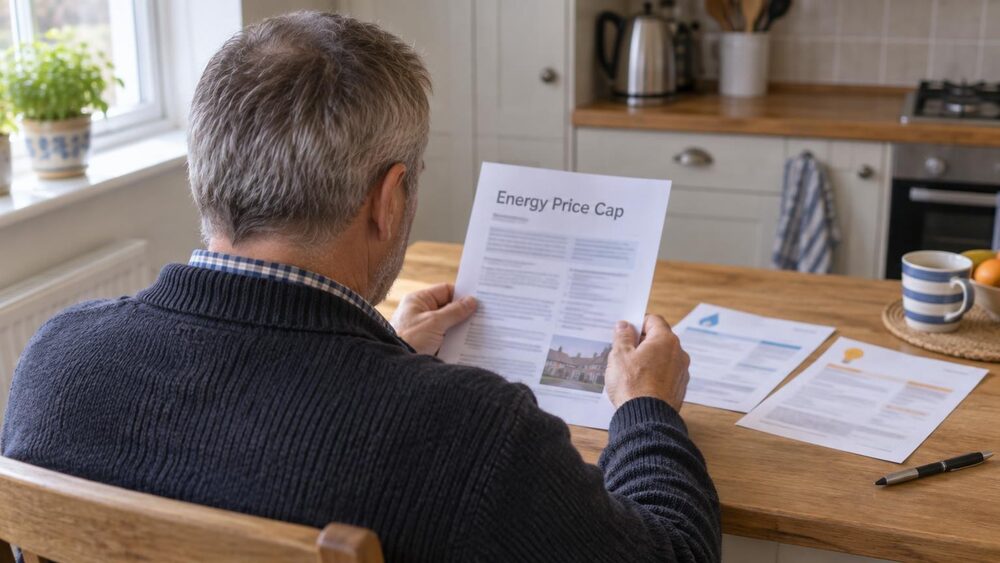
Ofgem reduced its Typical Domestic Consumption Values (TDCVs) again in July 2026, reflecting further falls in median average household consumption1. The assumed annual level for gas fell by 17% to 9,500 kWh and the level for electricity by 7% to 2,500 kWh1. TDCVs are the industry standard values for the annual gas and electricity usage of a typical domestic consumer2.
The change follows an earlier reduction. Ofgem introduced lower TDCVs for all its relevant publications from October 2023, cutting assumed annual gas consumption from 12,000 kWh to 11,500 kWh and electricity from 2,900 kWh to 2,700 kWh1. The Scottish Government's fuel poverty scenario modelling describes the same sequence, noting the July 2026 revision to 9,500 kWh of gas and 2,500 kWh of electricity for the typical dual fuel household2.
The TDCV is a communication device rather than a price. The energy price cap sets the maximum unit price per kWh and the maximum daily standing charge suppliers can charge for gas and electricity, and varies by energy supply region, payment method and meter type2. Because the cap is expressed to consumers as an annual bill for typical consumption, a lower TDCV makes an average bill for typical consumption look lower even if prices per unit of energy are unchanged; it does not affect trends in prices or bills1. Fuel poverty calculations are affected by the capped price of fuels, not by the communicated TDCV figure2.
Under the July to September 2026 direct debit cap the average annual bill for typical gas and electricity consumption is £1,663, against a peak of £2,106 under the Energy Price Guarantee from October 2022 to June 2023, and 18% higher than the recent low in July to September 20241. Current direct debit cap rates are 7.3p per kWh for gas and 26.1p per kWh for electricity, with average standing charges of 29.0p per day for gas and 57.2p per day for electricity1.
| Period | Gas unit (p/kWh) | Gas standing (p/day) | Electricity unit (p/kWh) | Electricity standing (p/day) |
|---|---|---|---|---|
| Jul to Sept 2026 | 7.3 | 29.0 | 26.1 | 57.2 |
| Oct to Dec 2026 | 8.0 | 29.7 | 26.3 | 54.8 |
Source: Scottish Government, Table 1, GB averages for direct debit customers2. The October to December 2026 figures show changes of 8.8%, 2.2%, 0.8% and -4.1% respectively on unrounded figures2.
"Ofgem reduced these TDCV levels again in July 2026, reflecting further falls in median average household consumption."
Why it matters for households
The TDCV change alters the yardstick, not the bill. Households that use more energy than the assumed typical level pay more, and those that use less pay less; annual bills are not capped1. The practical effect is that headline "typical household" figures published from July 2026 describe a smaller amount of energy than before, so comparisons with earlier periods rest on different consumption assumptions unless unit prices are used instead1.
The unit rates and standing charges that determine what households actually pay are unchanged by the TDCV revision. From October 2026 the average gas unit price under the direct debit cap rises 9% to 8.0p per kWh and the average electricity unit price rises 1% to 26.3p per kWh; the gas standing charge rises 0.7p per day while the electricity standing charge falls 2.4p per day1. The electricity values include the effect of the government's decision to remove VAT from electricity bills for six months from October 20261.
The cap applies in Great Britain. Energy prices in Northern Ireland are not controlled by the price cap, and only a minority of households there use mains gas for heating1. Since October 2023 the cheapest prices from Northern Ireland's largest supplier have been higher than prices under the cap in the rest of the UK1.
What happens next
The price cap will increase by 4% in the fourth quarter of 2026 and is currently forecast to increase by a further 9% in the first quarter of 20271. The Library briefing states that bills for typical consumption under the October to December 2026 cap will be 58% higher than in winter 2021/221. Forecasts of the price cap are uncertain1.

 Financial Ombudsman ServiceFree, independent help when a complaint about a firm is not put right
 FSCSProtects your money if a bank, insurer or investment firm fails
 FCA Warning ListCheck whether a firm is authorised before you deal with it
 MoneyHelperFree, impartial money and pensions guidance, set up by government
 Citizens AdviceFree advice on money, consumer and legal problems in England and Wales