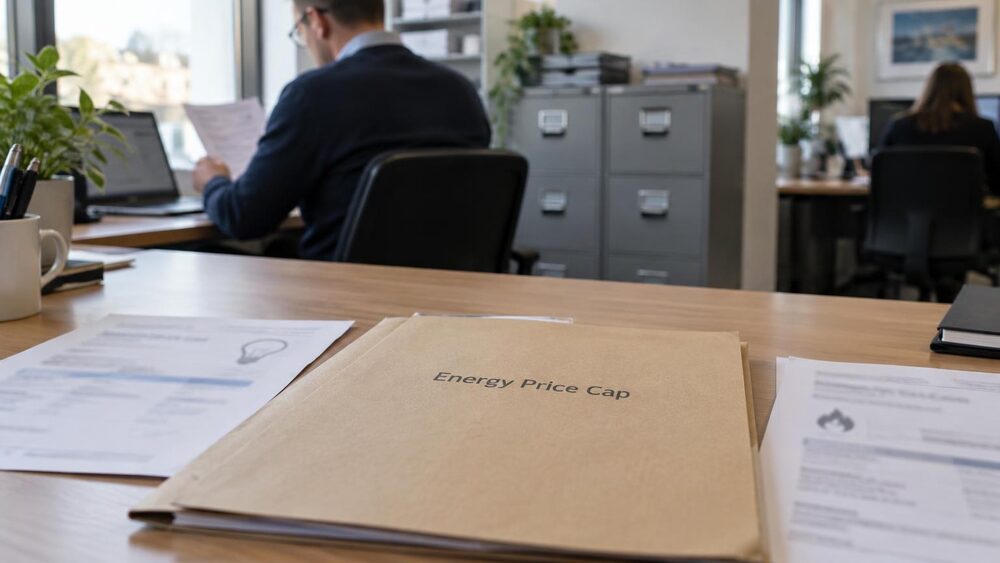
The energy price cap set by Ofgem fell on 1 April 2026, cutting the typical annual dual-fuel bill paid by direct debit from £1,758 to £1,641, a reduction of £1171. The cap limits the maximum that can be charged for each unit of gas and electricity and the standing charge on a standard variable tariff2. TransUnion, commenting on the Bank of England's decision to hold the base rate at 3.75%, said the cap would fall by 7% from 1 April4.
The Office for National Statistics said the reduction fed through to measured inflation. In its Household Costs Indices bulletin, it reported that "from April 2026 onwards annual inflation rates for gas and electricity fell, reflecting lower domestic energy prices. This decrease in energy prices was because of a reduction in the Office of Gas and Electricity Markets' (Ofgem's) energy price cap"5.
"Overall UK household costs, as measured by the Household Costs Index (HCI), rose by 2.8% in the year to June 2026; this is a decrease from 3.6% in the year to March 2026."
The HCI annual rate was 3.0% in both April and May 2026 before easing to 2.8% in June5. CPI inflation was 2.6% in the year to June 2026, leaving a gap of 0.2 percentage points between the two measures, unchanged from March5. Contributions from housing and household services to the HCI rate fell from 1.22 to 0.45 percentage points between March and June 2026, and food and non-alcoholic beverages fell from 0.45 to 0.20 percentage points. Transport contributions rose from 0.58 to 0.79 percentage points over the same period, driven by fuels and lubricants, which rose from 0.14 to 0.56 percentage points5.
Rates varied by household group in the year to June 20265:
| Group | Annual HCI inflation, June 2026 |
|---|---|
| All households | 2.8% |
| Low-income households (decile 2) | 2.7% |
| High-income households (decile 9) | 2.8% |
| Private renters | 3.0% |
| Outright owner-occupiers | 2.6% |
| Non-retired households | 2.9% |
| Retired households | 2.5% |
The ONS said this was the first month since March 2025 that lower-income households recorded a lower annual inflation rate than high-income households5. It attributed the narrowing mainly to housing and household services, and largely to electricity, gas and other fuels, where the difference in contributions between the two groups fell from 0.13 to negative 0.19 percentage points5.
The energy reduction came alongside other April increases. Average water bills in England and Wales rose 5.4%, or £33, to a typical £639, with Southern Water customers facing the highest average bill at £759; Scottish bills rose by an average of £42 (8.7%) to £5321. The TV licence fee rose from £174.50 to £1801. Vehicle excise duty for cars registered after April 2017 rose from £195 to £2001. First-class stamps rose 10p to £1.80 and second-class stamps 4p to 91p from 7 April1. Council tax rose for many households, with many local authorities applying the maximum 4.99% without a referendum, comprising a 2.99% general rise and a 2% adult social care precept1. The Resolution Foundation put the average council tax increase at £111 more than last year for Band D homes in England, and said the lowest-income families spend nearly 5% of their income on the tax, against 1.5% for the richest households6.
Why it matters for households
The cap reduction applied from 1 April 2026 and set the maximum unit rates and standing charges for households on standard variable tariffs until the next cap period1. Which? reported that all households, including those on fixed deals, should see some savings from April because of changes to government policy costs, with some environmental scheme charges removed from bills1. The Joseph Rowntree Foundation said the annual price cap for a typical dual-fuel household paying by direct debit was £1,641 from 1 April to 30 June 20267.
The fall in measured energy inflation from April 2026 is a change in the rate at which prices rise, not a return to earlier price levels. The ONS reported cumulative HCI inflation over five years of 32.8% for high-income households and 32.7% for low-income households5. The Resolution Foundation put the energy bill fall at £135 for a typical household, a different figure from the £117 cited by Which?, Full Fact and yourmoney.com1. Full Fact reported that BBC News corrected a live blog post which had said the saving was £170; the Prime Minister said "We have capped energy bills until the end of June, saving the average household £117"2.
What happens next
Which? reported forecasts that the price cap could rise by around 10% in July 2026, taking a typical bill to roughly £1,801, citing wholesale gas prices and conflict in the Middle East1. The Joseph Rowntree Foundation said domestic energy prices would rise again by 13% for the July to September 2026 price cap, to the highest level since early 20247. The ONS next publishes Household Costs Indices on 27 November 20265.
Sources7 cited
- April 2026 bill rises: what’s going up and expert tips to cut costs - Which? which.co.uk
- BBC corrects misreported energy bills figure - Full Fact fullfact.org
- How to beat the ‘awful April’ price rises yourmoney.com
- Bank of England Announces Decision to Hold the Base Rate newsroom.transunion.co.uk
- Household Costs Indices for UK household groups - Office for National Statistics ons.gov.uk
- Priced out, held back, bench warmed • Resolution Foundation resolutionfoundation.org
- A Minimum Income Standard for the United Kingdom in 2026 | Joseph Rowntree Foundation jrf.org.uk

 MoneyHelperFree, impartial money and pensions guidance, set up by government
 Citizens AdviceFree advice on money, consumer and legal problems in England and Wales
 GOV.UKOfficial information on tax, benefits and government services
 StepChangeFree debt advice and solutions from a charity
 FSCSProtects your money if a bank, insurer or investment firm fails