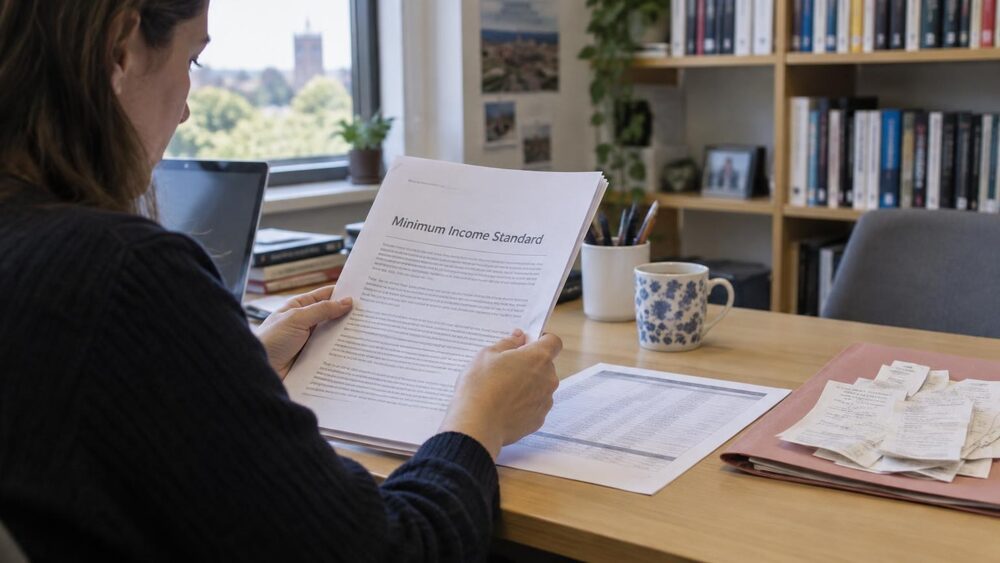
The Minimum Income Standard (MIS) is the income that people need in order to reach a minimum socially acceptable standard of living in the UK today, based on what members of the public think1. It is not a government benefit rate or a statutory pay floor. It is a research benchmark, built by asking groups of ordinary people what households like theirs need in order to live with dignity and take part in society, and then pricing those needs in real shops.
The definition the research uses goes beyond survival. As the standard itself puts it:
"A minimum standard of living in the UK today includes, but is more than just, food, clothes and shelter. It is about having what you need in order to have the opportunities and choices necessary to participate in society."2
The headline figure for 2026 is that a single working-age adult needs to earn £31,500 a year to reach MIS3. A couple with two children needs £77,400 a year between them, and a lone parent with two children needs £67,6003. The research is carried out by the Centre for Research in Social Policy at Loughborough University and funded by the Joseph Rowntree Foundation (JRF), and it has been monitoring living standards in the UK since 20084.
What the Minimum Income Standard measures
The Minimum Income Standard is a measure of what incomes different households require to reach a minimum socially acceptable living standard7. Since 2008, the research has identified what different household types need for a minimum, based on what goods and services members of the public say are needed6. The study then calculates how much people have to earn, after tax, to afford that basket of goods and services8.
The households it covers are specific case studies rather than averages: a single working-age person, a couple, a lone parent with one child, a couple with two children, and pensioner singles and couples. Children are defined as individuals aged under 16, or aged 16 to 19, not married or living with a partner, living with a parent or responsible adult, and in full-time non-advanced education or unwaged government training2. Pensioners are defined as all those adults above state pension age2.
A companion strand of research monitors how many people fall below the standard. It tracks the number of people living below the MIS threshold, as well as how many are well above and how many are well below it9. This is what makes MIS useful as a living standards benchmark: it gives a threshold against which the whole income distribution can be measured, not just a poverty count. The way poverty itself is officially measured is covered separately in how poverty and low income are measured in the UK.
How the budgets are set: members of the public decide what is needed
The distinctive feature of MIS is that members of the public, not experts, decide what goes into the budgets. The research asks members of the public what goods and services they think different types of households need to live to an adequate level10. Groups typically comprise 7 to 10 people from a mixture of socioeconomic backgrounds, though all participants within each group share the relevant characteristics of the household type being discussed6.
The process runs through several stages. The first-stage orientation groups are 2 hours long. The task groups each spend 6 hours discussing the needs of a case study individual. Two sets of checkback groups, each 3 hours, test the emerging lists, and final groups, also 3 hours, settle what goes into the budget6. The 2024 rebase drew on more than 130 hours of discussion with members of the public held throughout the UK from May 2023 to March 20246. The 2026 review comprised 13 groups, each with between 7 and 9 participants, with fieldwork between October 2025 and February 20263.
Once the groups have agreed the basket, researchers price it. Food and drink budgets are priced at Tesco, which the groups have repeatedly agreed is appropriate because it is the largest UK supermarket chain, so the whole list can be bought in one shop3. Most household goods are costed at relatively inexpensive retailers such as supermarkets, Argos, B&M and The Range, and beds and sofas at retailers such as DFS, Dreams and IKEA6. In the 2024 rebase, all items were priced in April 20246.
The standard is updated annually, following a cycle of rebase, inflation uprating and review3. In 2024, all household types were rebased, meaning budgets were developed from scratch with groups of members of the public, for the first time since MIS was introduced in 20086. In odd-numbered years, budgets are uprated by inflation, applying changes in broad categories of the budget using the Consumer Prices Index6. The 2025 update was based largely on price changes as captured through the CPI4, and the 2023 update used the same method11. Comprehensive new research across all household types now takes place every two years6, and each household type is fully refreshed every four years12.
What a single adult needs to earn: £31,500 a year
A single working-age adult needs to earn £31,500 a year to reach MIS in 20263. That figure has climbed steeply over the life of the research. In 2025 the figure was £30,5004, in 2024 it was £28,0006, in 2023 it was £29,50011, and in April 2022 it was £25,50013. Going further back, single people needed £17,100 a year before tax in 201510 and the same in 20148, £16,400 in 201214, £15,000 in 201115 and £13,900 in 200916.
The earnings a single working-age adult needs, from the first years of the research to 2026.
The 2026 figure includes a broader additional healthcare budget of £200 per year for each parent and working-age adult without children, and for pensioners3. That reflects a change in what the public considers necessary: items that once counted as extras are now part of the minimum.
The long-run rise is not just inflation. By 2018, minimum household budgets had risen by about a third since 2008 for most household types, and by a half for pensioners, compared with a 25 per cent rise in the Consumer Prices Index over the same period17. In other words, what people need, in the public's own judgement, has grown as well as become more expensive. How inflation itself is measured is explained in CPI and CPIH.
What families need: couples, lone parents and the cost of children
Families with children need substantially more, and the cost of children is a large part of the gap. In 2026, a couple with two children needs to earn £77,400 a year between them, and a lone parent with two children needs £67,6003. In 2023, a couple with two children needed £50,000 between them11.
Earlier years show the same shape. In 2013, couples with two children needed to earn at least £19,400 each, working full time, and the combined annual earnings requirement for a couple with two children was £38,75918. In 2012, two parents needed to earn at least £18,400 each to support themselves and two children14. A lone parent with one child needed £25,586 in April 201318, £23,861 in April 201214 and £18,243 in April 201115.
Childcare is treated as a necessary cost where parents work. Since 2016, the consensus in the research has been that nurseries are the necessary minimum to budget for, to allow parents of toddlers and preschool children to work6. Back in 2011, making up the childcare shortfall for a lone parent would have required an extra £1,000 a year in disposable income15.
Out-of-work benefits fall far short of these budgets. In 2026, out-of-work support provides 24% of the income required for working-age households without children, 28% for couple parents and 36% for lone parents, after housing costs3. Even in 2022, with the cost-of-living support payments added, a couple with two children on out-of-work benefits had just over 52% of MIS13.
Pensioners and the Minimum Income Standard
The pensioner budgets define how much income pensioners need for a minimum socially acceptable standard of living in the UK today19. They are based on the needs of hypothetical households, singles and couples, aged 72 and without significant health problems19.
That reference age matters. An MIS based on a relatively healthy person in their early 70s may be of limited relevance to a pensioner a decade or so older, whose needs, and often costs, are different19. The standard is a benchmark for pensioner households in general, not a forecast of any individual's spending.
Pensioner budgets have risen faster than most. Between 2008 and 2018, minimum budgets for pensioners rose by about a half, against about a third for most other household types17. Earlier, between 2008 and 2012, the pensioner couple's budget had risen 15% while the Consumer Prices Index rose 14%14.
The pensions industry uses a related set of figures. The PLSA Retirement Living Standards set a minimum standard of £10,900 a year for a single person in 2021/22, produced through ongoing research funded by the Joseph Rowntree Foundation on Minimum Income Standards20. At the moderate standard, the assumed food shop is Tesco with 50% branded goods, and at the minimum standard, Tesco mainly with Tesco brands20.
Policy attention has been growing. The Work and Pensions Committee has recommended that the Government should decide on and ensure a minimum level of retirement income21, and MPs have called for a national strategy to tackle pensioner poverty22.
London costs more: the separate MIS for London
London has its own Minimum Income Standard, maintained with the anti-poverty charity Trust for London. The Trust's 2026 thresholds are based on the MIS for London in April 2025 prices7. The main UK figures, by contrast, track living standards for people living in urban UK outside London3.
The London weekly budgets for 2026 show how much more the capital costs7:
| Household type | Inner London | Outer London |
|---|---|---|
| Couple, working-age | £662 per week | £687 per week |
| Lone parent, one child aged one | £485 per week | £492 per week |
| Couple with two children aged three and seven | £859 per week | not given |
| Single pensioner | £270 per week | not given |
The gap between London and the statutory pay floors has been wide for years. In 2017, the difference between the Living Wage Foundation's real Living Wage and the National Minimum Wage or National Living Wage was between £2.37 and £4.30 per hour in London23. The difference between the real Living Wage and the government minimums, and what each is based on, is explained in National Living Wage or real Living Wage: what each is.
Remote rural and island areas: budgets up to 31% higher
Households in remote rural, remote small town and island areas need more than the urban UK standard, sometimes much more. Research for these areas, in 2022 prices, found the following uplifts over the urban UK MIS5:
| Household type | Urban UK MIS | Remote rural mainland | Islands |
|---|---|---|---|
| Single working-age | £11,950 | 27% higher | 31% higher |
| Working-age couple | £20,100 | 28% higher | not given |
| Couple with two children | £21,380 to £44,000 | 15% higher | 14% higher |
| Single pensioner | £10,240 | 26% higher | not given |
| Pensioner couple | £16,150 | 19% higher | 24% higher |
The 90% thresholds used in some official tests are also published: £13,658.85 for a single working-age person at 90% of the remote rural mainland standard, £14,089.05 at 90% of the island standard, £23,155.20 for a working-age couple at 90% of the mainland standard and £24,059.70 at 90% of the island standard, and £11,612.16 and £17,296.65 for a single pensioner and pensioner couple at 90% of the remote rural mainland standard5.
The 90% figure is not arbitrary. Scotland's official fuel poverty definition uses a test of whether a household's remaining adjusted net income is at least 90% of the UK Minimum Income Standard, after housing, fuel and childcare costs, to be considered an acceptable standard of living24. So the Minimum Income Standard directly shapes who counts as fuel poor in Scotland. Similar modelled estimates are produced for Wales24.
How far benefits and the National Living Wage fall short
The National Living Wage is the statutory minimum wage for workers aged 21 and over25. From April 2026 it rises by 4.1 per cent to £12.71 per hour25. The Government asks the Low Pay Commission to ensure the rate does not drop below two-thirds of UK median earnings for workers in the National Living Wage population26. That target is about median earnings, not about the Minimum Income Standard, and the two can diverge sharply.
In 2026, a lone parent with two children working full-time on the National Living Wage reaches 67% of MIS, and a couple with two children where both parents work full-time on the NLW reaches 80%3. In 2022, a couple with two children with one parent working full-time on the National Living Wage reached 79% of MIS even with the cost-of-living support payments13.
For self-employed people on Universal Credit, there is a different connection. The minimum income floor, which can apply to gainfully self-employed claimants, is based on what an employed person on minimum wage would expect to earn in similar circumstances27. So the statutory minimum feeds directly into benefit assessments for the self-employed.
The picture for out-of-work benefits is starker still. In 2026, out-of-work support provides 24% of the income required for working-age households without children, 28% for couple parents and 36% for lone parents, after housing costs3. The 2021 report looked at whether people can reach current levels of MIS based on benefits, Universal Credit and the National Living Wage13, and the answer for most households without earnings was no. How the pay floors themselves are set and uprated is covered in National Living Wage and National Minimum Wage.
How MIS compares with poverty lines and median income
MIS sits above the official relative poverty line. In the original 2008 study, over 96 per cent of individuals classified as being in poverty, in the households covered by the study, were below MIS9. In other words, the official poverty measure and MIS identify almost the same people as poor, but MIS sets the income needed for a decent standard considerably higher than the poverty threshold.
The standard can also be expressed relative to median income. In 2009/10, the income required for MIS, after housing costs, was 74% of median income for a single working-age person, 54% for a pensioner couple and 73% for a lone parent with one child15. By 2010/11, the lone parent figure was 77%14 and the pensioner couple figure 57%14. A household at MIS is therefore not rich: it is living on something like half to three-quarters of what the typical household has, but with enough, in the public's judgement, to participate in society.
The relationship between these measures matters for how poverty statistics are read. The official measures are explained in how poverty and low income are measured in the UK, and the wider income distribution in household incomes across the four nations.
What MIS leaves out: housing, childcare and other limits
The headline earnings figures need careful reading. The original 2008 amounts were after income tax and did not include housing or childcare costs9, and later budget comparisons for Northern Ireland likewise excluded housing and childcare28. The earnings figures are what a household must earn so that, after tax and after its housing and childcare costs as modelled, it can afford the minimum basket.
Housing costs are modelled rather than taken from any individual's actual bills. Rents are based on private rents for relevant property sizes in the East Midlands, which is a median to low rent area3. For homeowners, the model takes mortgage payments into account, but not the cost of maintaining the home2. For tenants, it is based on what the public thinks tenants would need to spend as a minimum2. Anyone whose rent or mortgage costs more than the model assumes needs more than the headline figure to reach the same standard.
There are other limits to bear in mind:
- The budgets are for specific case-study households, not for every family shape and size.
- The pensioner budgets assume a healthy person aged 72, and may be of limited relevance to pensioners a decade or so older19.
- Percentages in the reports are rounded to the nearest 0.1%2.
- The main UK figures cover urban UK outside London; London has its own standard3, and remote rural and island areas have separate, higher budgets5.
The standard applies to the whole of the UK4, and there has been dedicated Minimum Income Standard research for Northern Ireland, where the standard was updated in July 2009 to reflect changes in prices28. But a national figure is a benchmark, not a personal budget: anyone wanting to check their own household can use the Minimum Income Calculator, which the research team publishes to work out whether a household earns enough for a decent standard of living29.
Sources29 cited
- Households living below a Minimum Income Standard 2008-2022 Joseph Rowntree Foundation
- Households living below a Minimum Income Standard 2008-2024 Joseph Rowntree Foundation, 2026-02-18
- A Minimum Income Standard for the United Kingdom in 2026 Joseph Rowntree Foundation, 2026
- A Minimum Income Standard for the United Kingdom in 2025 Joseph Rowntree Foundation, 2025-09-09
- Minimum Income Standard for remote rural, remote small town and island areas Consumer Scotland, 2022
- A Minimum Income Standard for the United Kingdom in 2024 Joseph Rowntree Foundation, 2024-09-02
- Poverty thresholds for London Trust for London, 2026
- A Minimum Income Standard for the UK in 2014 Joseph Rowntree Foundation, 2014
- A Minimum Income Standard for Britain: what people think Joseph Rowntree Foundation, 2008
- A Minimum Income Standard for the UK in 2015 Joseph Rowntree Foundation, 2015
- A Minimum Income Standard for the United Kingdom in 2023 Joseph Rowntree Foundation, 2023
- Households living below a Minimum Income Standard 2008-2023 Joseph Rowntree Foundation, 2025-02-19
- A Minimum Income Standard for the United Kingdom in 2022 Joseph Rowntree Foundation, 2022
- A Minimum Income Standard for the UK in 2012 Joseph Rowntree Foundation, 2012
- A Minimum Income Standard for the UK in 2011 Joseph Rowntree Foundation, 2011
- A Minimum Income Standard for Britain in 2009 Joseph Rowntree Foundation, 2009
- A Minimum Income Standard for the UK 2008-2018: continuity and change Joseph Rowntree Foundation, 2018-07-02
- A Minimum Income Standard for the UK in 2013 Joseph Rowntree Foundation, 2013
- Minimum Income Standards and older pensioners' needs Joseph Rowntree Foundation, 2013-01-28
- Retirement Living Standards in the UK in 2023 Pensions and Lifetime Savings Association, 2023
- MPs call for national strategy to tackle pensioner poverty UK Parliament, 2025-07-24
- Work and Pensions Committee report on pensioner incomes UK Parliament
- Rates: National Minimum Wage, National Living Wage and Living Wage Full Fact, 2017-09-01
- Fuel poverty modelled estimates for Wales, October 2024 Welsh Government, 2025-10-16
- LPC recommendations take the National Living Wage to £12.71 GOV.UK, 2026
- National Living Wage estimate update GOV.UK, 2025-08-05
- Self-employment and Universal Credit GOV.UK, 2026-09-26
- A Minimum Income Standard for Northern Ireland Joseph Rowntree Foundation, 2009-09-29
- A Minimum Income Standard for the United Kingdom in 2019 Joseph Rowntree Foundation, 2019-07-03


 MoneyHelperFree, impartial money and pensions guidance, set up by government
 Citizens AdviceFree advice on money, consumer and legal problems in England and Wales
 GOV.UKOfficial information on tax, benefits and government services
 StepChangeFree debt advice and solutions from a charity
 FSCSProtects your money if a bank, insurer or investment firm fails